A three-dimensional static graph viewer.
JSDoc generated API documentation can be found here.
<html>
  <head>
    <style>
    #graph {
      width: 500px;
      height: 500px;
      border: 1px solid grey;
    }
    </style>
  </head>
  <body>
    <div id="graph"></div>

    <script src="graphosaurus.min.js"></script>
    <script>
      // JavaScript will go here
    </script>
  </body>
</html>
If you open this up in your web browser, you'll see something that looks like this:
Look at that amazing square! Now lets create a graph, a couple nodes, and an edge between the nodes:
var graph = G.graph()

// Create a red node with cartesian coordinates x=0, y=0, z=0
var redNode = G.node([0, 0, 0], {color: "red"});
graph.addNode(redNode);

// You can also use the addTo method to add to the graph
var greenNode = G.node([1, 1, 1], {color: "green"}).addTo(graph);

var edge = G.edge([redNode, greenNode], {color: "blue"});
graph.addEdge(edge);  // or edge.addTo(graph)

// Render the graph in the HTML element with id='graph'
graph.renderIn("graph");
After inserting this JavaScript in the <script> block, you should see this:
While this is a very basic example, I hope I've demonstrated how simple it is to create graphs with Graphosaurus.
- Run
git clone https://github.com/frewsxcv/graphosaurus.gitto clone this repository - Install node, npm, and grunt-cli
- Run
npm installto install all the build requirements - Run
gruntto build Graphosaurus. The resulting compiled JavaScript will be indist/and the docs will be indoc/
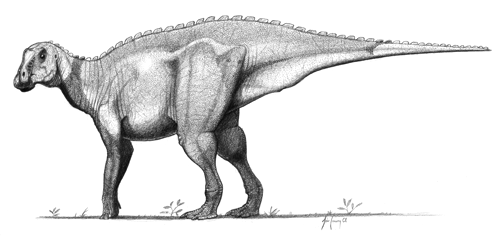
John Conway's illustration of our glorious leader, the gryposaurus graphosaurus.
All files in this repository are licensed under version two of the Mozilla Public License.
Graphosaurus has some third party dependencies listed in the package.json file in the devDependencies and dependencies sections. Their licenses can be found on their respective project pages.


