Skip to content

Using R and ggplot2 to create graphics and analyse temperatures in different countries

Notifications You must be signed in to change notification settings

nilsonsales/Climate-Change-Analysis

Repository files navigation

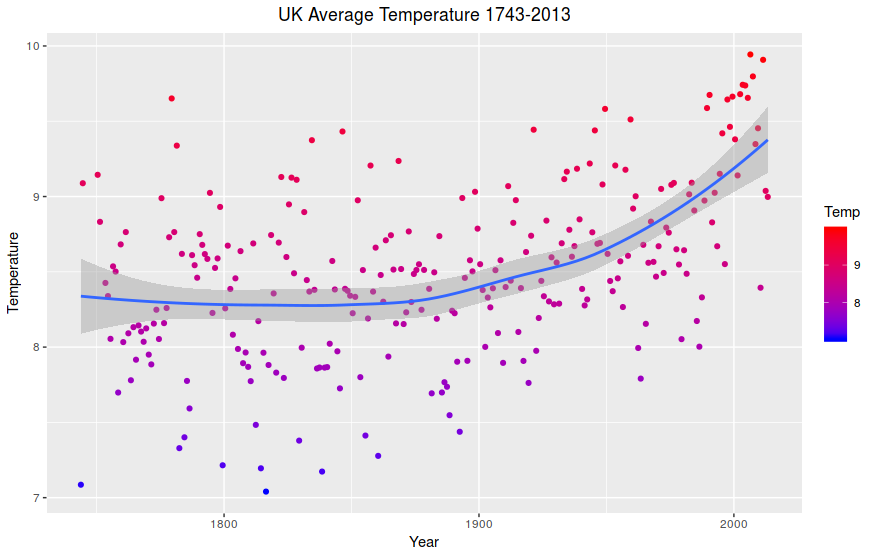
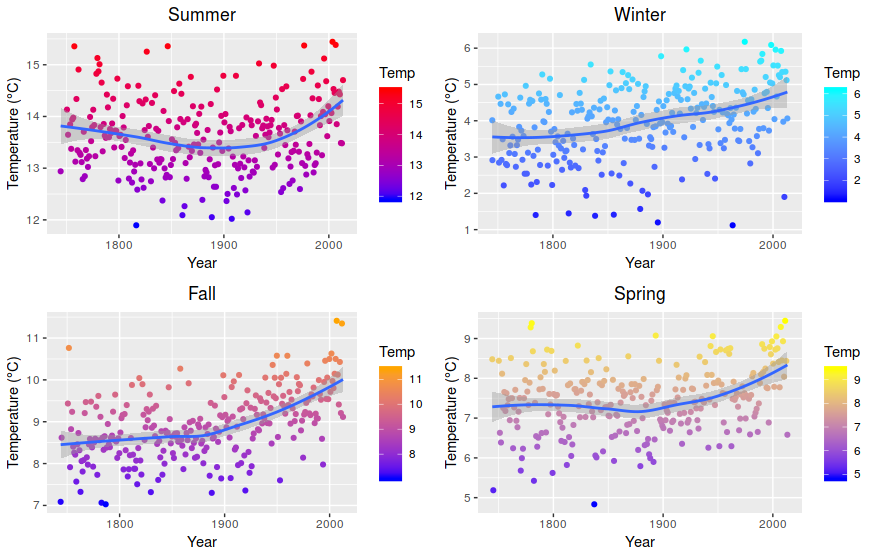
Climate Change Analysis

Using R and ggplot2 to create graphics and analyse temperatures in different countries.

alt text

alt text

About

Using R and ggplot2 to create graphics and analyse temperatures in different countries

Resources

Stars

Watchers

Forks

Releases

No releases published

Packages

No packages published