Graphviz-server is a lightweight Java based HTTP server that invokes the Graphviz dot binary installed locally. You simply submit a HTTP POST with the dot graph as the request body and the server returns back a graph in SVG, PDF or PNG format. Graphviz-server uses the Graphviz Java API, a Java wrapper that invokes the dot binary using Runtime.exec.
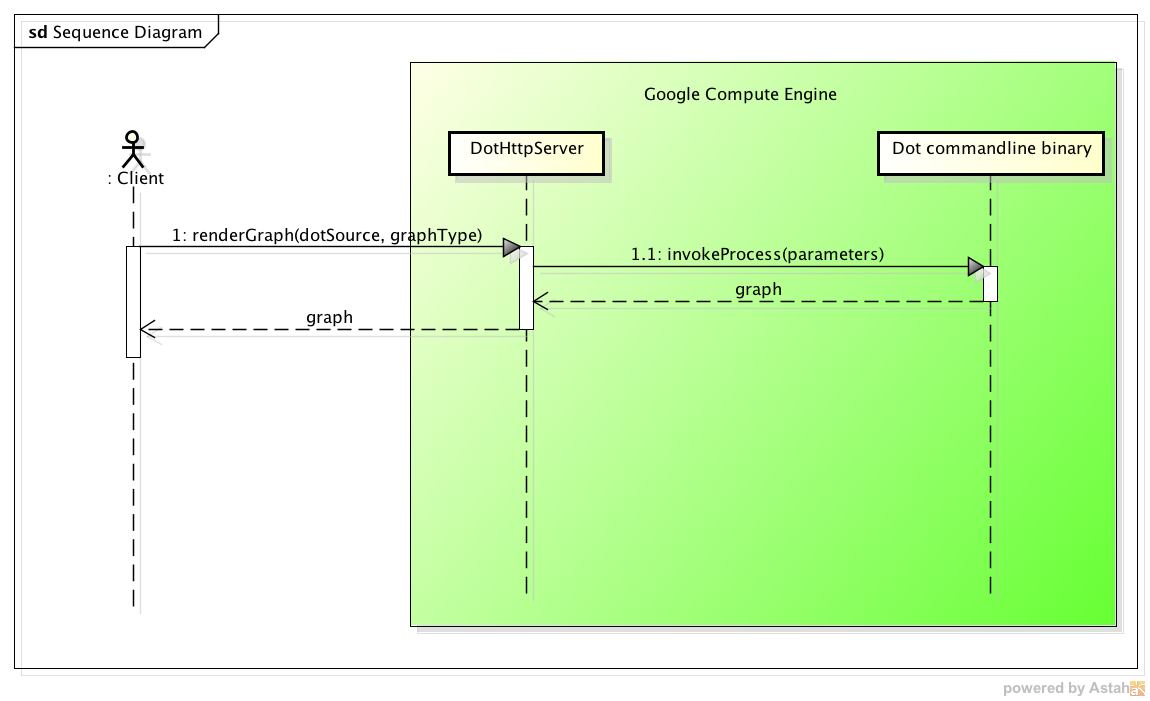
A typical usage is demonstrated in this sequence diagram:
Source: github.com/omerio/graphviz-server
Author: Omer Dawelbeit
Graphviz is a powerful open source graph visualization and layout tool, unfortunately no runtime exists for Java, so the only option is to invoke the dot binary from a running Java application. This option might not be possible or practical for many reasons, for example:
- If you are running your app in a Platform as a Service (PaaS) environment like Google App Engine where you can't install extra software.
- You can't install the dot binaries in the server running your code, or you need to access Graphviz from more than one server.
- You don't want your application to have a dependency on the dot binary.
In the cases mentioned above, it does make sense to setup one graphviz-server in a separate environment, and then access it from all your applications that require graphs to be generated.
Here is a demo running on Google App Engine http://dot-graphics1.appspot.com/.
The source code for the demo is here. The graphviz-server is installed on a Google Compute Engine VM (see documentation section below).
- Clone the git repository -
git clone https://github.com/omerio/graphviz-server - An executable jar with dependencies is included in the dist folder. The port on which the server listens can be configured as a command line parameter to the jar. To change the default port (8080) edit the DotGraphics.sh in the dist directory:
#!/bin/sh
java -jar DotGraphics.jar 8080 > /dev/null 2>&1 &
exit 0
- If you want to make changes to the code and build your own jar, you need to have Maven installed. Simply run
mvn packagethis will create a jar with dependencies inside the target directory.
Run the graphviz-server:
./DotGraphics.sh
The graphviz-server uses Log4j for logging. All incoming requests are logged to DotGraphics.log, a sample output is provided here.
To use the Graphviz server simply submit a HTTP POST with the dot graph script set as the request body. Optionally an output type can be specified on the URL for example:
- Post to http://localhost:8080/svg to render the graph as SVG
- Post to http://localhost:8080/pdf to render the graph as PDF
- Post to http://localhost:8080 to render the graph as PNG (default)
Note: The server will validate that the dot graph starts with digraph G {, if this is not your desired behaviour, you can remove the second check on the HttpDotGraphMessageHandler.java.
If you are using Docker and would like to run graphviz-server in a Docker container, I've created a Ubuntu Docker image. There is a Dockerfile in the source if you want to build your own image.
For more details on the implementation of graphviz-server and a detailed guide on how to set it up on Google Compute Engine VM, see this blog post:
http://omerio.com/2013/11/03/running-a-graphviz-server-on-google-compute-engine/.
Open Source (Apache License 2.0)
