-
Notifications
You must be signed in to change notification settings - Fork 1.5k
New issue
Have a question about this project? Sign up for a free GitHub account to open an issue and contact its maintainers and the community.
By clicking “Sign up for GitHub”, you agree to our terms of service and privacy statement. We’ll occasionally send you account related emails.
Already on GitHub? Sign in to your account
otelcol can't get cpu limit and may cause performance issues. #4459
Comments
|
That is just a log message. The CPU limitation comes from the k8s itself which throttles the process when gets to the limit. We don't do anything with "NumCPU" except that we print it. If you believe that it is confusing we can remove that message. |
|
It's not a problem, of course, but it actually used here |
|
@morigs interesting. Now we can have a long debate here, usually the operation executed after batching is an I/O op (not that CPU intensive). If we limit that to 1 core (in your example) we will never be able to hit probably 0.7 cores. So not sure what is the best in this case. |
|
@bogdandrutu
|
|
I am curious about the same potential issue. We use opentelemetry collector as a sidecar on GKE. We use 0.48.0 and I see this in the logs
which is the virtuals CPU. We allocate 1 to 4 CPU depending on the deployment. So for the 1 CPU pods are we potentially having issues? We do pretty high volumes of traffic. |
|
Prometheus has a currently-experimental |
I'm in favor of giving this a try. @open-telemetry/operator-approvers , what do you thin? |
|
Should this be implemented as a core feature enabled by default? Or as an extension? |
Agee on improving this. What changes are proposed for the operator? Should the operator set |
Yes, I think it would be a good start. |
|
How would a cpu limit of 0.9 or 1.1 then be reflected? Is it just |
|
I would round it up: 0.9 becomes 1, 1.1 becomes 2. |
|
I accidentally stumbled onto the same problem as we were experiencing a lot of throttling during a spike of traffic. Seems to me that there already exists a mechanism to set env:
- name: GOMAXPROCS
valueFrom:
resourceFieldRef:
containerName: otc-container
resource: limits.cputo either the CR for the operator or directly into the deployment. Is there a scenario where using the roundup mechanism of native k8s is not as good? |
Any container environment other than k8s that does not easily support a mechanism as |
By setting `GOMAXPROCS` to the number of available CPUs available to the
pod via the 'downward API'[1]. This is based on[2], otherwise the
collector will use `runtime.NumCPU` (i.e. number of processors available
to the _node_) when setting up batch processing.

[1] https://kubernetes.io/docs/concepts/workloads/pods/downward-api/#downwardapi-resourceFieldRef
[2] open-telemetry/opentelemetry-collector#4459 (comment)
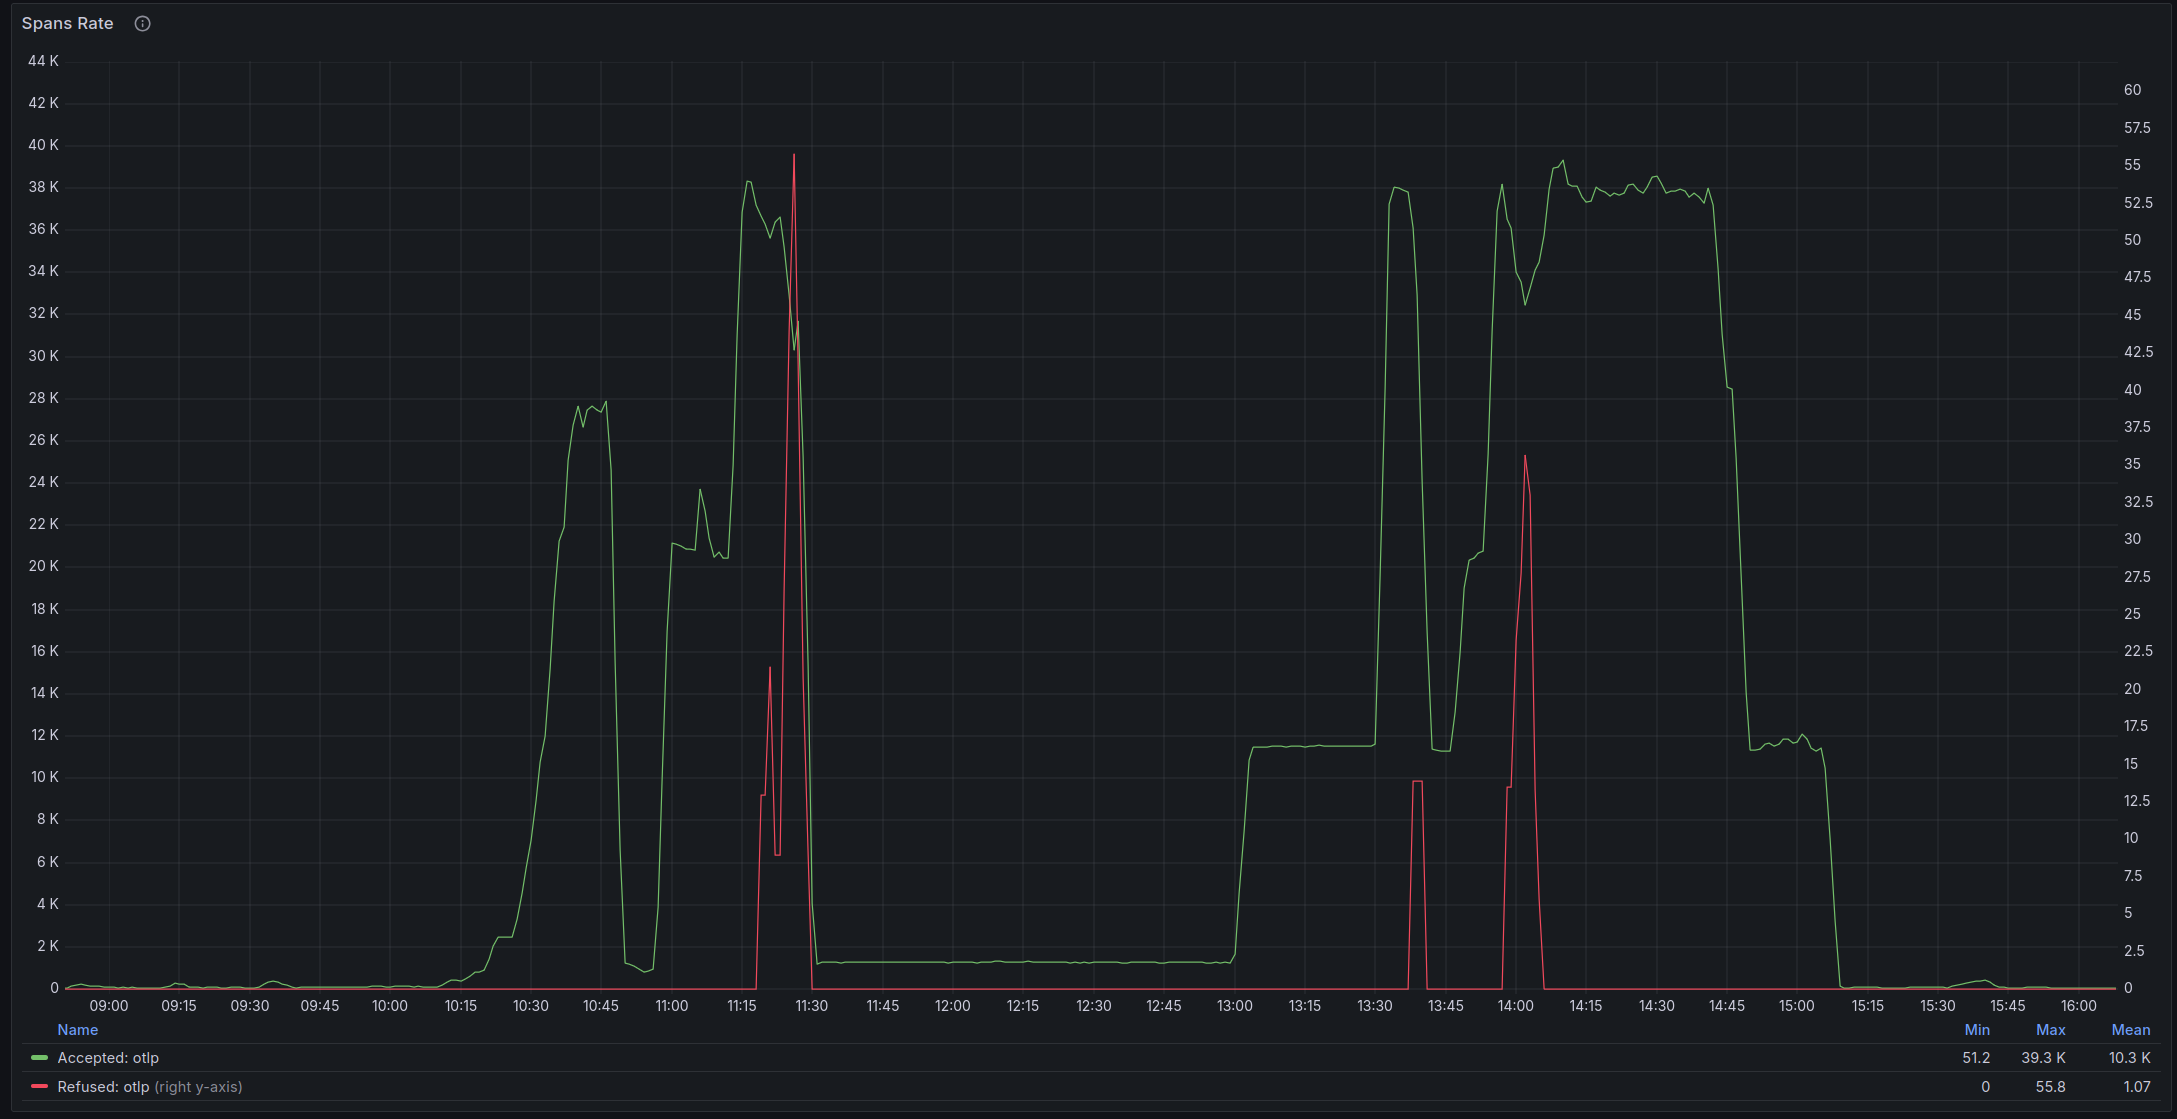
By setting `GOMAXPROCS` to the number of available CPUs available to the pod via the 'downward API'[1]. This is based on[2], otherwise the collector will use `runtime.NumCPU` (i.e. number of processors available to the _node_) when setting up batch processing. Some experimentation: I modified our pubsub producer to start producing _lots_ of messages (and hence events) to stress test the collector, before this change, once the collector queue was full it seemed like nothing, even adding a bunch more pods, would resolve the issue, here is the rate of span production:  Which quickly filled up the collector queue:  However, even if I added a bunch more pods they would just start throttling:  Though the CPU usage never looked alarming (i.e. it never approached the limit of `2`):  With this change in place we were able to process more events with the same number of pods:  without _any_ CPU throttling, though the queue did still build up, but I expect this could be resolved by adjusting our `HorizontalPodAutoscaler` For comparison, here's CPU usage with the fix:  [1] https://kubernetes.io/docs/concepts/workloads/pods/downward-api/#downwardapi-resourceFieldRef [2] open-telemetry/opentelemetry-collector#4459 (comment)
Describe the bug
Steps to reproduce
Limit the CPU resource to 1 with K8S node has 4 CPUs.
What did you expect to see?
otelcol could get the CPU limit.
What did you see instead?
otelcol get the CPU number of the node.
What version did you use?
Version: v0.37.1
What config did you use?
Environment
GKE v1.19.14-gke.1900
Additional context
So far, the CPU num was used in a set of limited features like bathProcessor and converter. It could be a risk in the feature.
The text was updated successfully, but these errors were encountered: