-
Notifications
You must be signed in to change notification settings - Fork 8
Network and attributes visualization
There are two ways of configuring the network visualization:
-
Visualization settings box to configure the general visual properties of the network elements (either nodes and edges). You can either set a uniform configuration (default) or use the data attributes to create a visual style according them (attribute-dependent).
- [Default] (Network-and-attributes-visualization#wiki-default)
- [Attribute-dependent] (Network-and-attributes-visualization#wiki-attribute-dependent)
- [Assign one to one] (Network-and-attributes-visualization#wiki-assign-one-per-one)
- [Direct mapping] (Network-and-attributes-visualization#wiki-direct-mapping)
- [Continuous mapping] (Network-and-attributes-visualization#wiki-continuous-mapping)
- Toolbar to configure a subset of selected nodes or edges and also the background.
##Visualization settings box
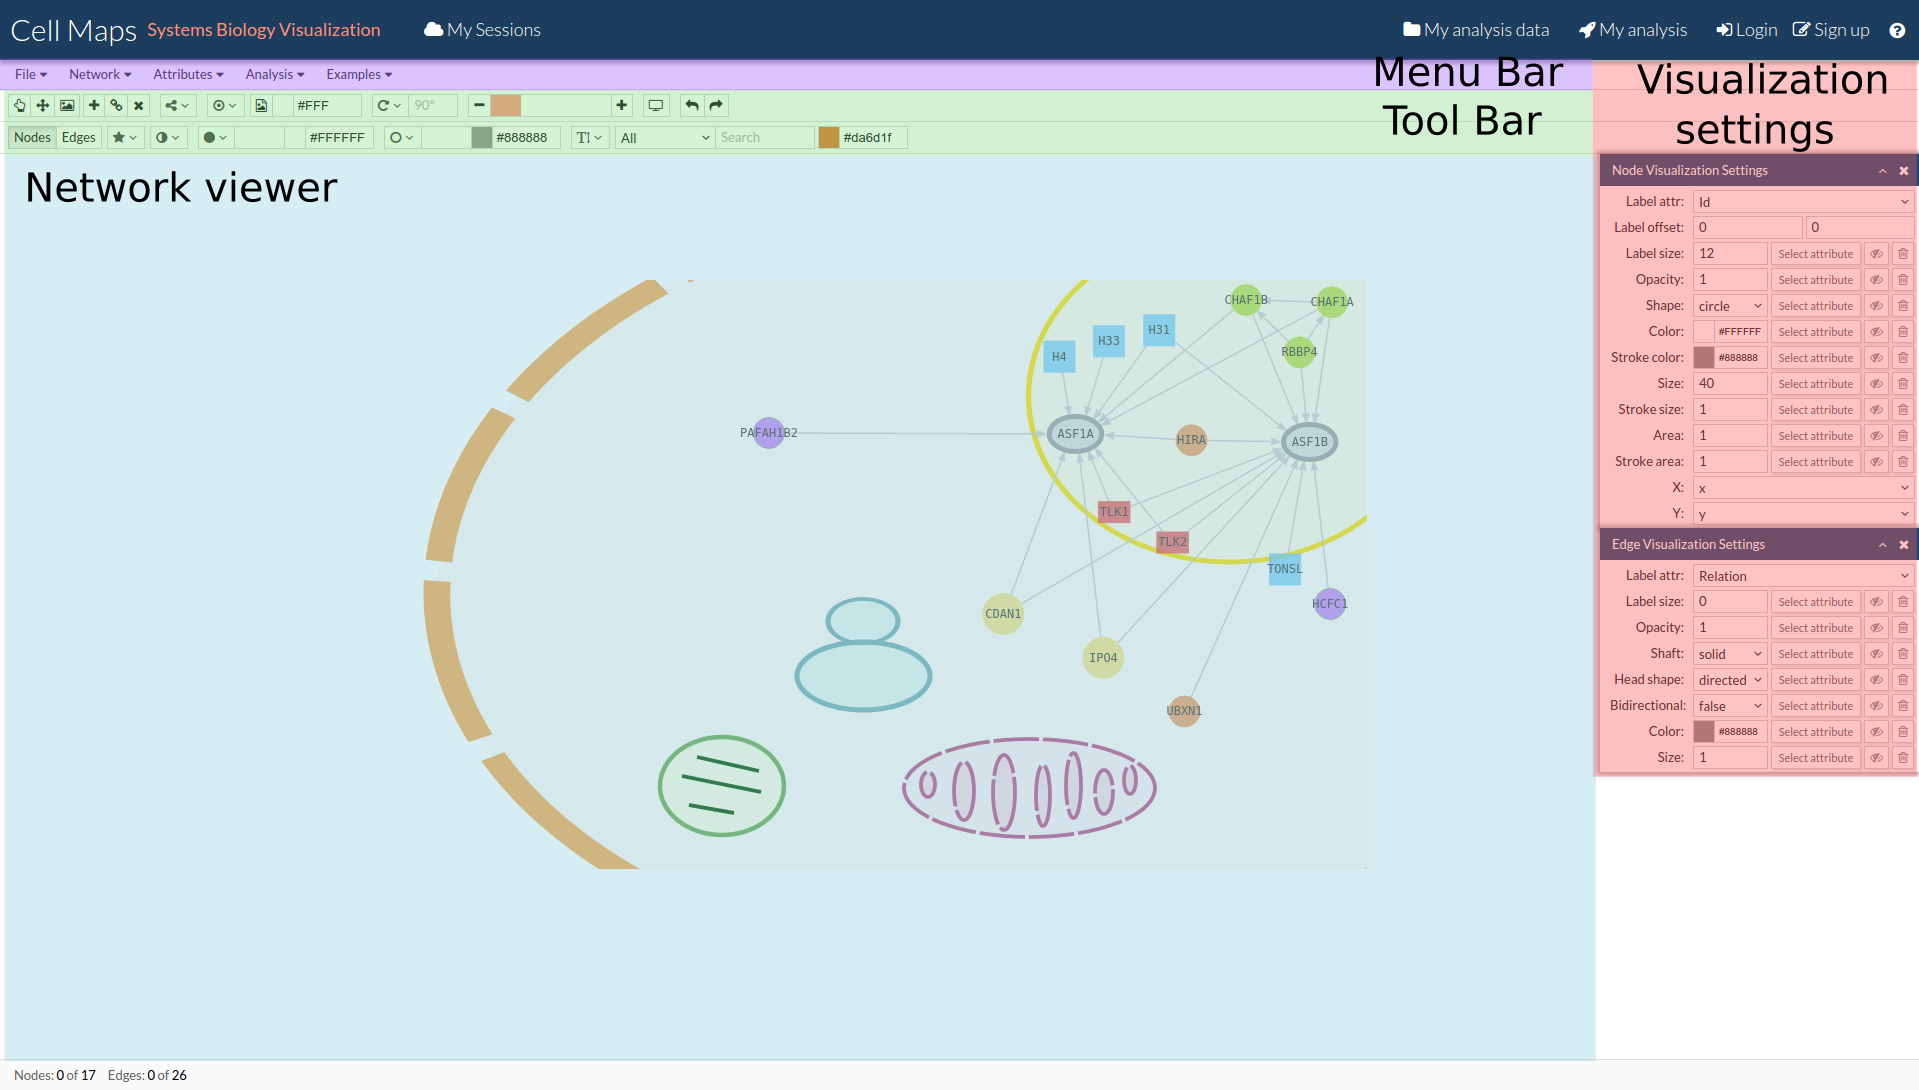
Visualization settings box is located at the right side of CellMaps (red region in the image).
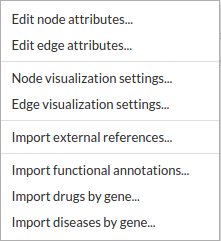
If you can not see it, go to Attributes in the menu bar and clic on 'Node/Edge visualization settings':
Visualization settings box looks like the image below, and contains two boxes, one for nodes and the other for edges:
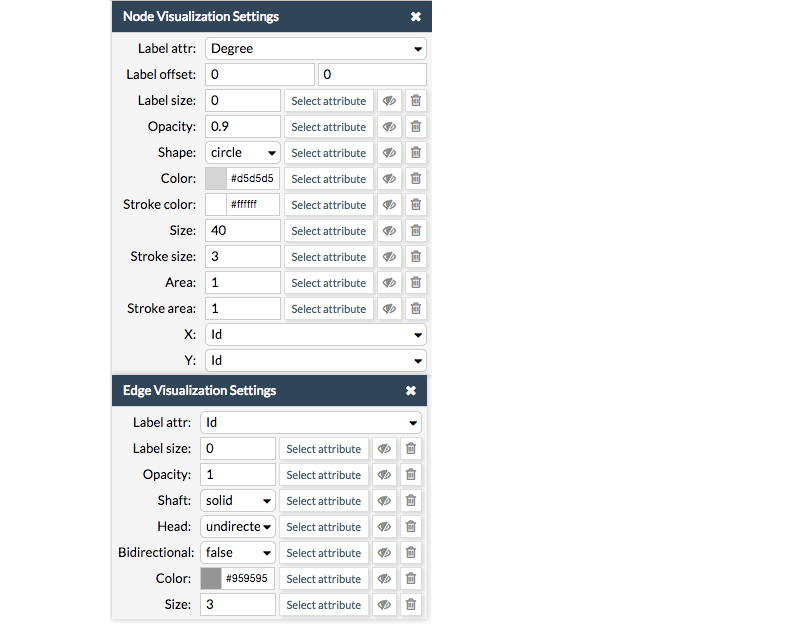
In each box, you have the visualisation parameters available for nodes and edges. You can configure the visual style by selecting a default value for each parameter (default) or make the visual style dependent on the attribute data (attribute-dependent). See the sections below for more information about each option.
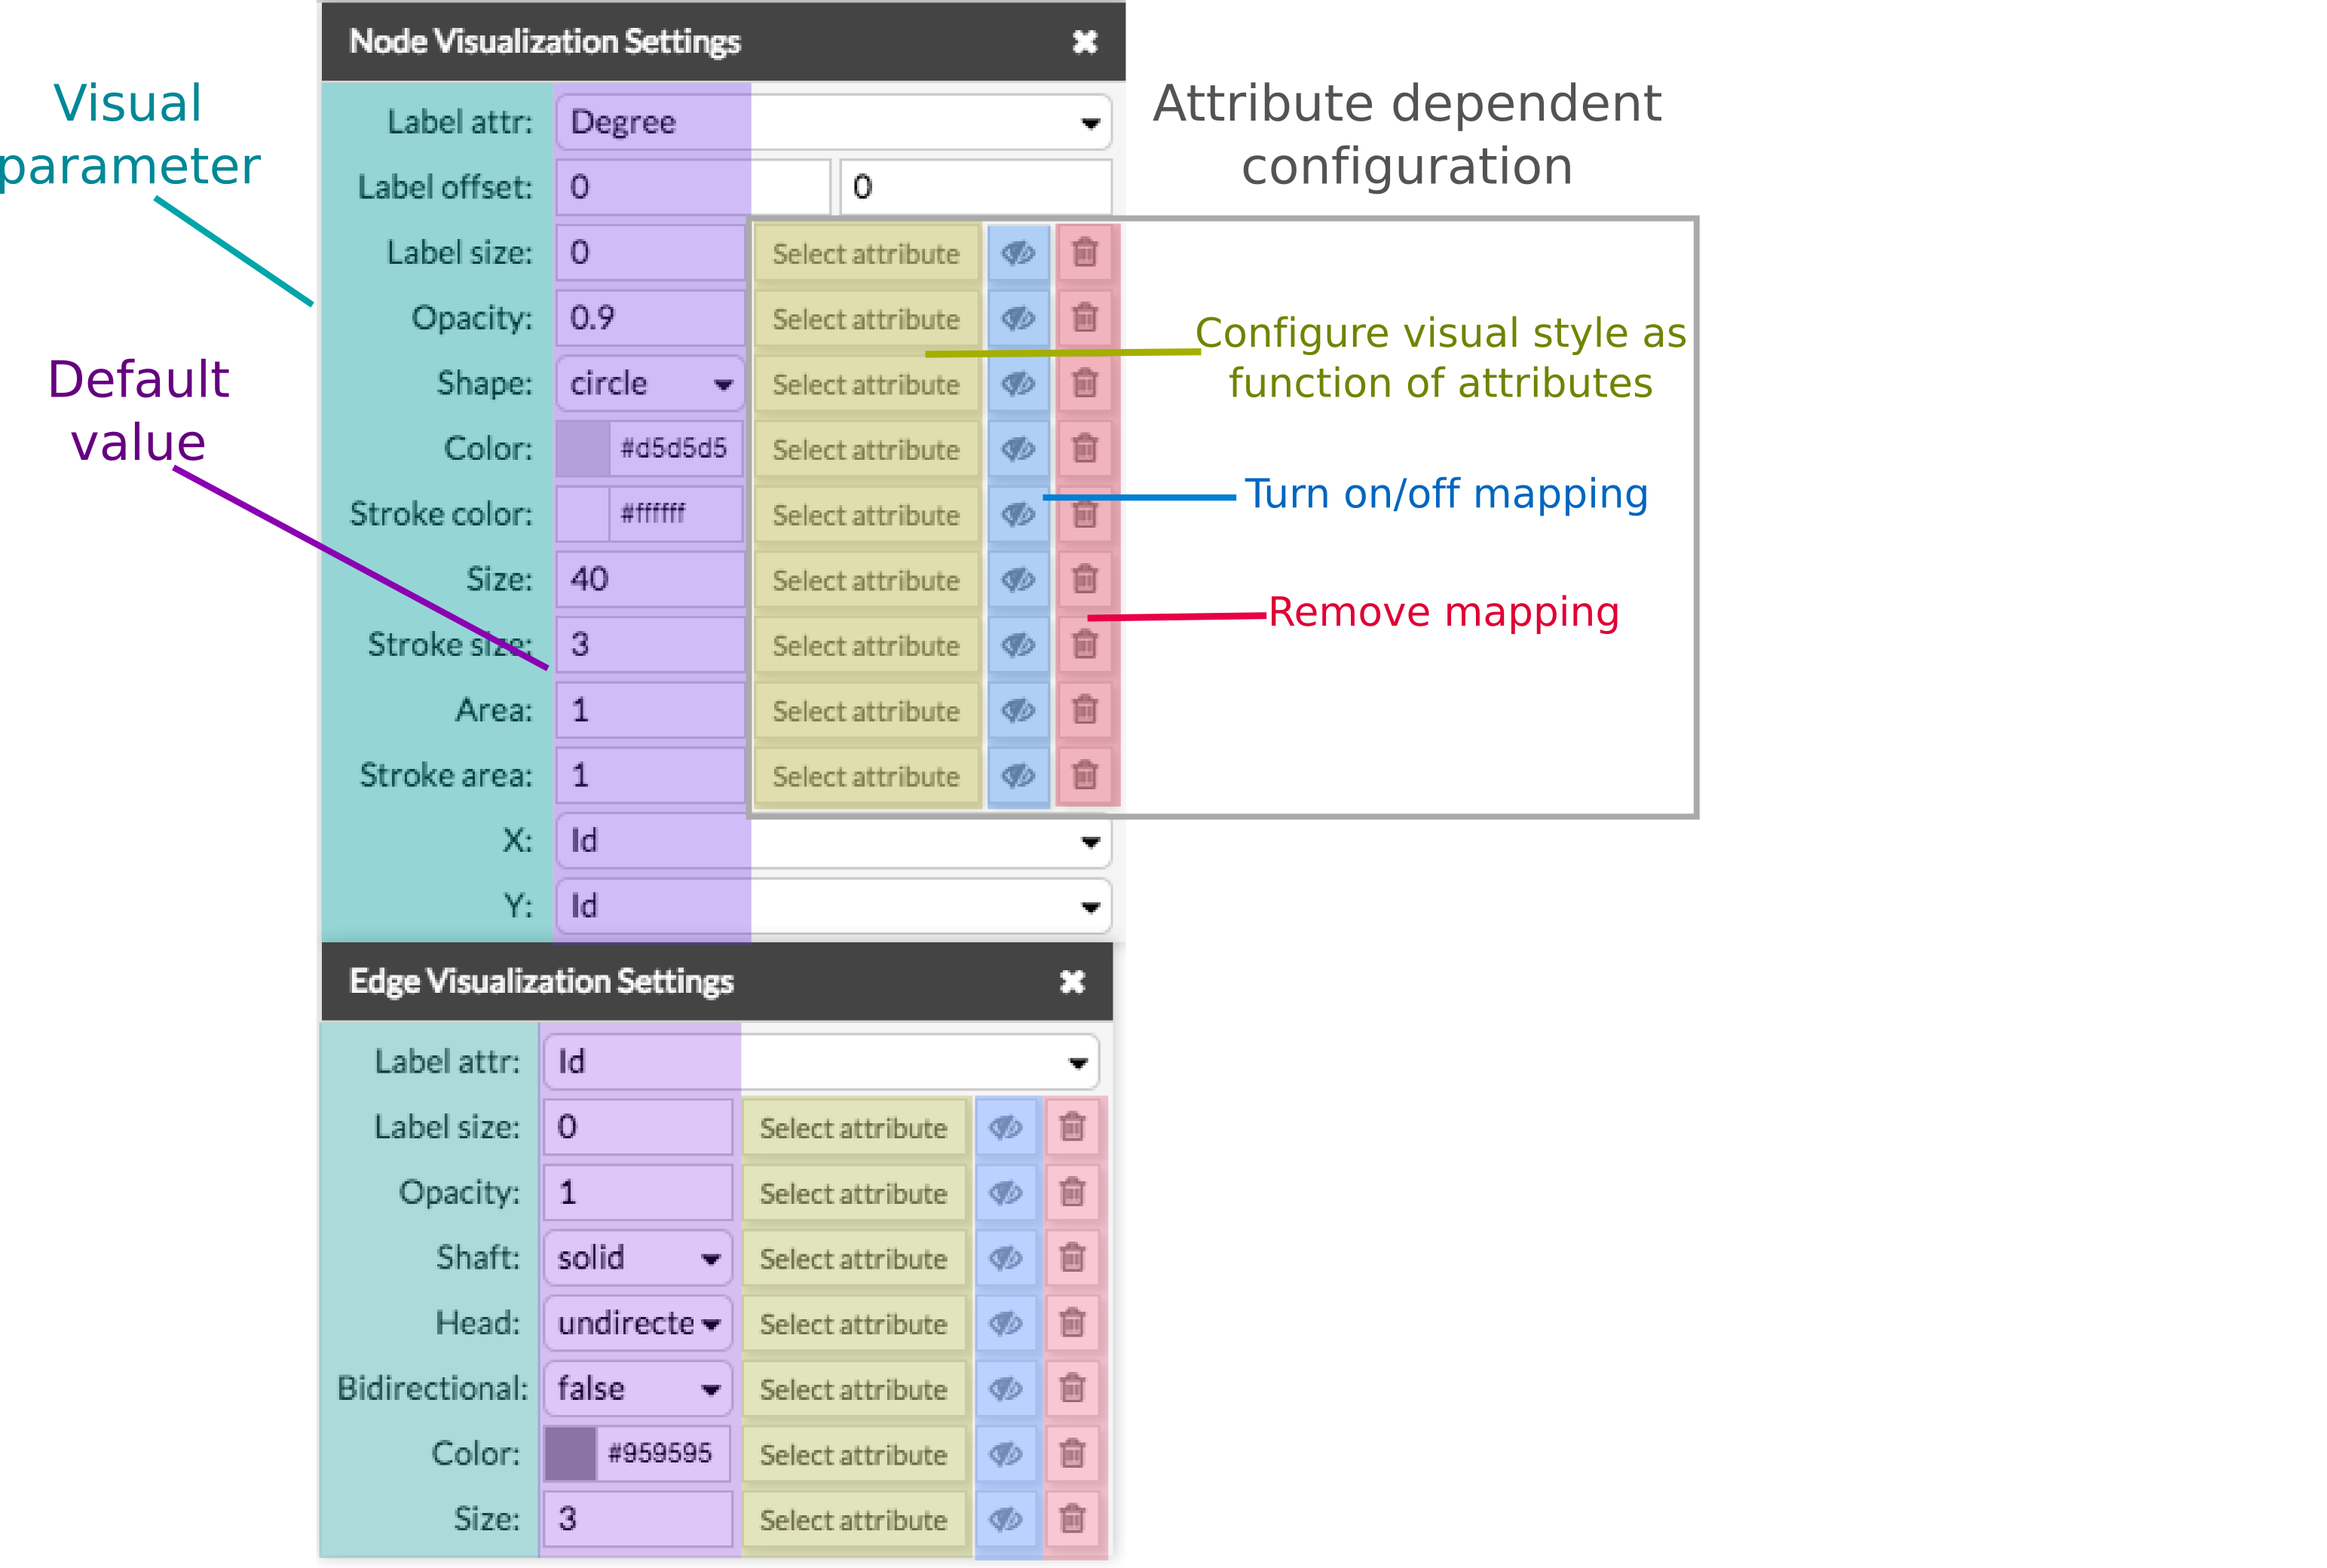
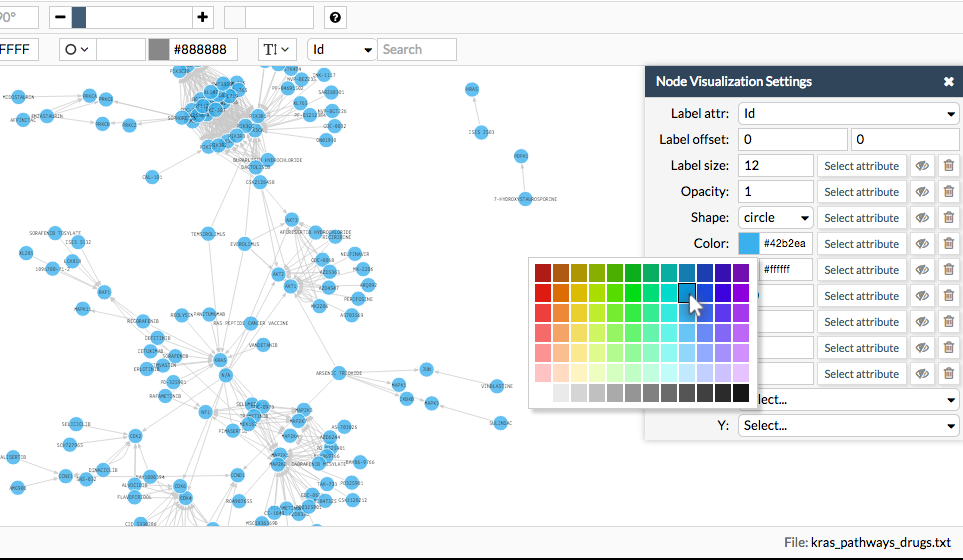
To configure the default visual style of your network, assign a value to the visual parameter in the second column box. This will be applied globally on your network and will be considered your default configuration. For example, in the image below, we are changing the default node color as blue.
CellMaps also offers you the possibility of making the visualization dependent on other data, that is, by means of integrating external data onto your network. The external data that you can associate to either nodes or edges are called attributes. Lear more about attributes here.
NOTE: CellMaps allows you to configure either a simple o more complex advanced visualization dependent on your attributes. The following lines give a general overview of this functionality. For more complex cases, go to Advanced visualization page.
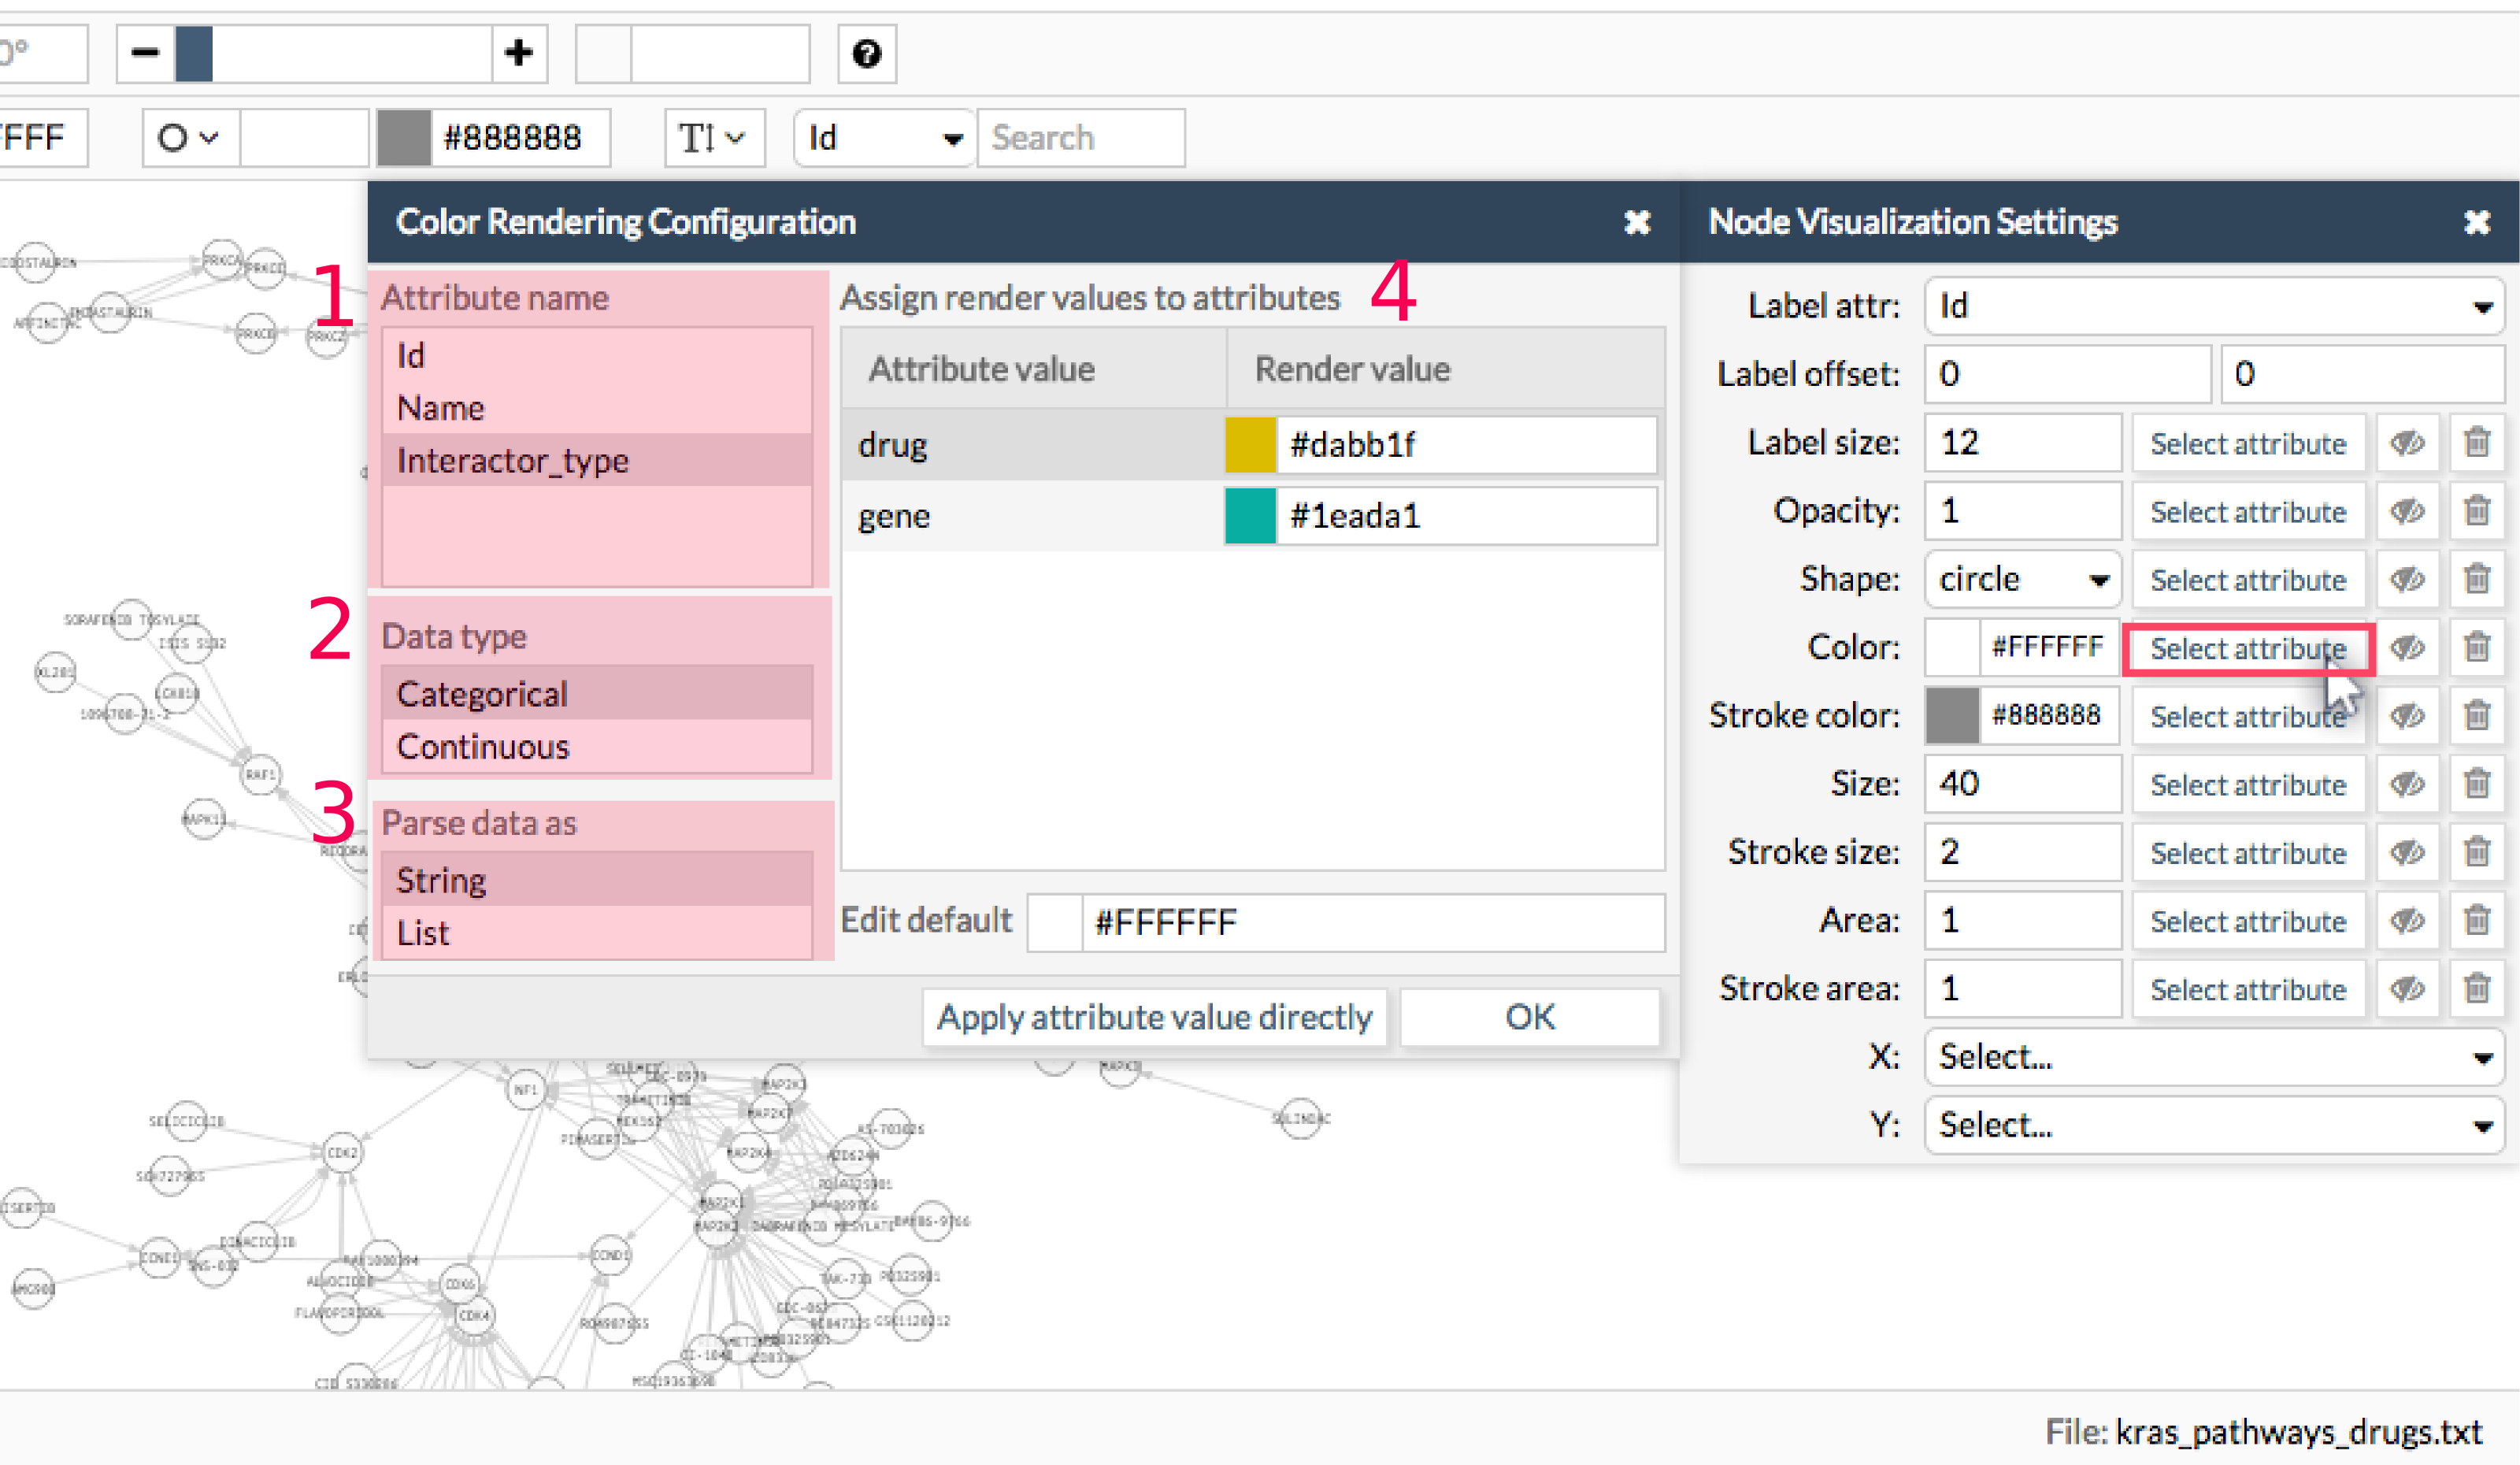
To make the visualization dependent on a given attribute, click on the third column box (see in the image the tool button). A window will appear (see the image below). Here you have to select the attribute you want to map and tell CellMaps a little bit of info about the type of data and how you want to use it. It is very easy, just follow these steps:
- Select the attribute name.
- Indicate the attribute type (categorical or continuous)
- Indicate how the data should be parsed (as string or a list of elements). If your data is a list of elements, each element should be separated by comma ','.
- Assign a visual parameter (also called render value).
There are three ways to assign a visual parameter to each attribute value (step 4):
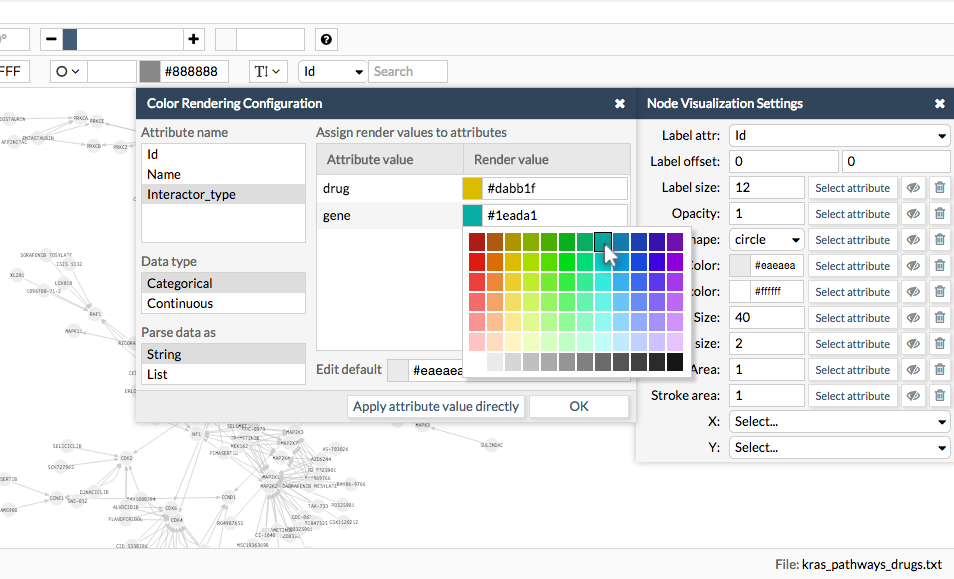
You can associate a render value to each attribute value using the 'Assign render values to attributes' table. Here, for each parameter value, choose a render value by clicking on the render value box. A pop up or pull-down menu will appear with the disponible options.
#####Direct mapping
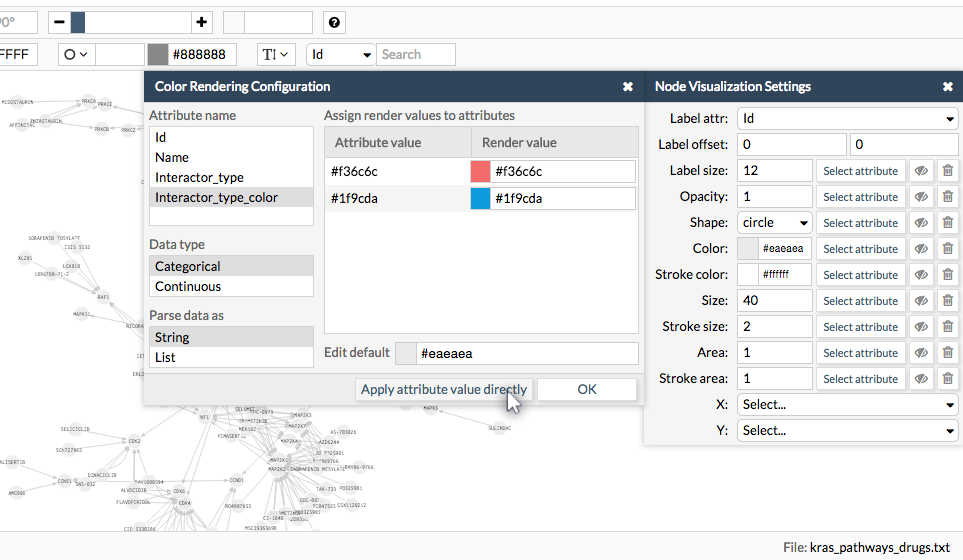
With this option you can use the attribute value as render value directly by clicking on the 'Apply attribute value directly' button. Note that, for this case, the attribute value should match a render value (if color, then colors in html format; if size, then a integer; etc).
#####Continuous mapping
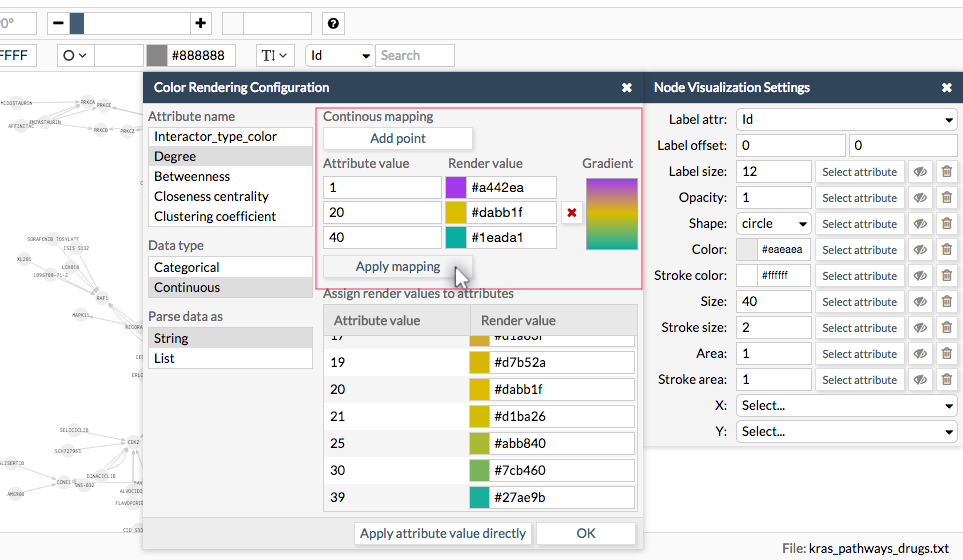
This case is specific for continuous numeric attributes. Here, you can generate a gradient of render values that will be proportional to your continuous attribute values. Be sure to select continuous in the 'data type' field. Then introduce the range of attribute values to consider and assign a render value to each point in the range. You can add as many intermediate points as you need. A preview of the generated gradient will be displayed in the 'Gradient' box. Once the gradient is set, click 'apply mapping'
##Toolbar
Toolbar is located at the top side of CellMaps (green region in the image).

Toolbar includes the commonly used functions for editing and configuring the network (first row), nodes and edges (second row).
![toolbar sections] (../wiki/images/toolbar_edition_sections.png)
- In the first row (network toolbar), you have all the actions available for the network display such as layouts, rotate, selection, change background color or use an image from file, etc.
- In the second row (node/edge toolbar) you have the actions available for editing the selected nodes or edges. Use the 'node/edge' button to switch between both elements. NOTE that with the toolbar, actions are only applied to the selected nodes or edges. If you want to assign a default configuration to the whole elements, use the Visualization settings box.
To see the description of each button, put the mouse pointer over and wait momentarily for a tooltip. The following table describes each of the toolbar buttons.
| Icon | Name | Description |
|---|---|---|
 |
Layout | Render the whole graph using different algorithms. Default: force directed |
 |
Background | Change the color of the background, select a predefined image or upload your own image |
 |
Zoom | Increase or decrease the network view |
 |
Node Name | Show and edit the name of the selected node |
 |
Edge Name | Show and edit the name of the selected edge |
 |
Node Shape | Change the shape of the selected node(s) |
 |
Edge Shape | Change the shape of the selected edge(s) |
 |
Node fill color & size | Change the color and size of the selected node(s) |
 |
Node stroke color & size | Change the border color and size of the selected node(s) |
 |
Edge fill color & size | Change the color and size of the selected edge(s) |
 |
Opacity | Changes the transparency of the selected node/edge(s) |
 |
Label size | Change the font size of the node/edge(s) labels |
 |
Search | Search nodes or edges according the node id or an attribute (ex. node name). Also you can choose the color used to highlight your search (orange by default) |
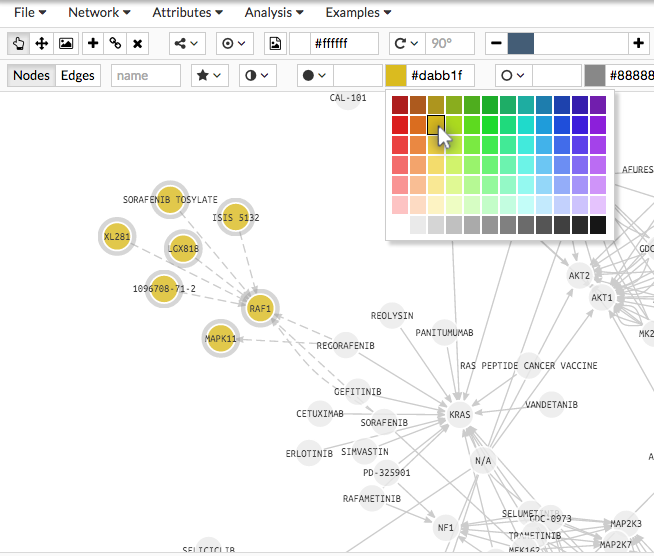
For example, imagine you want to color a subset of nodes. Select them with the mouse and then ...
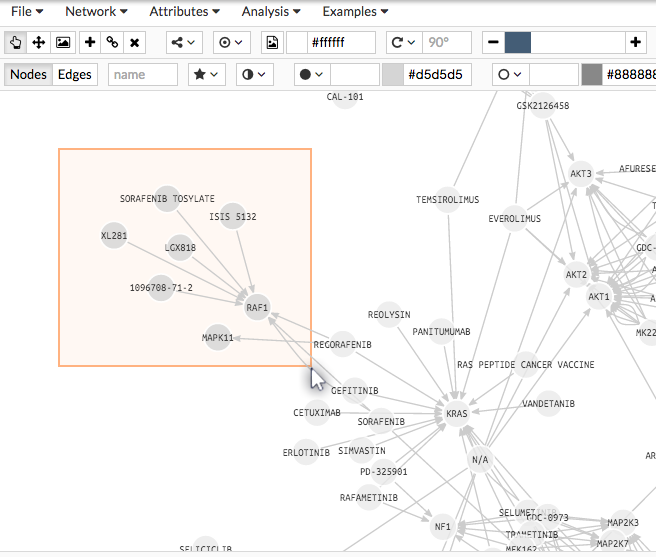
... just go to the 'color' button and choose one among the color grid. The same for the rest of features!
