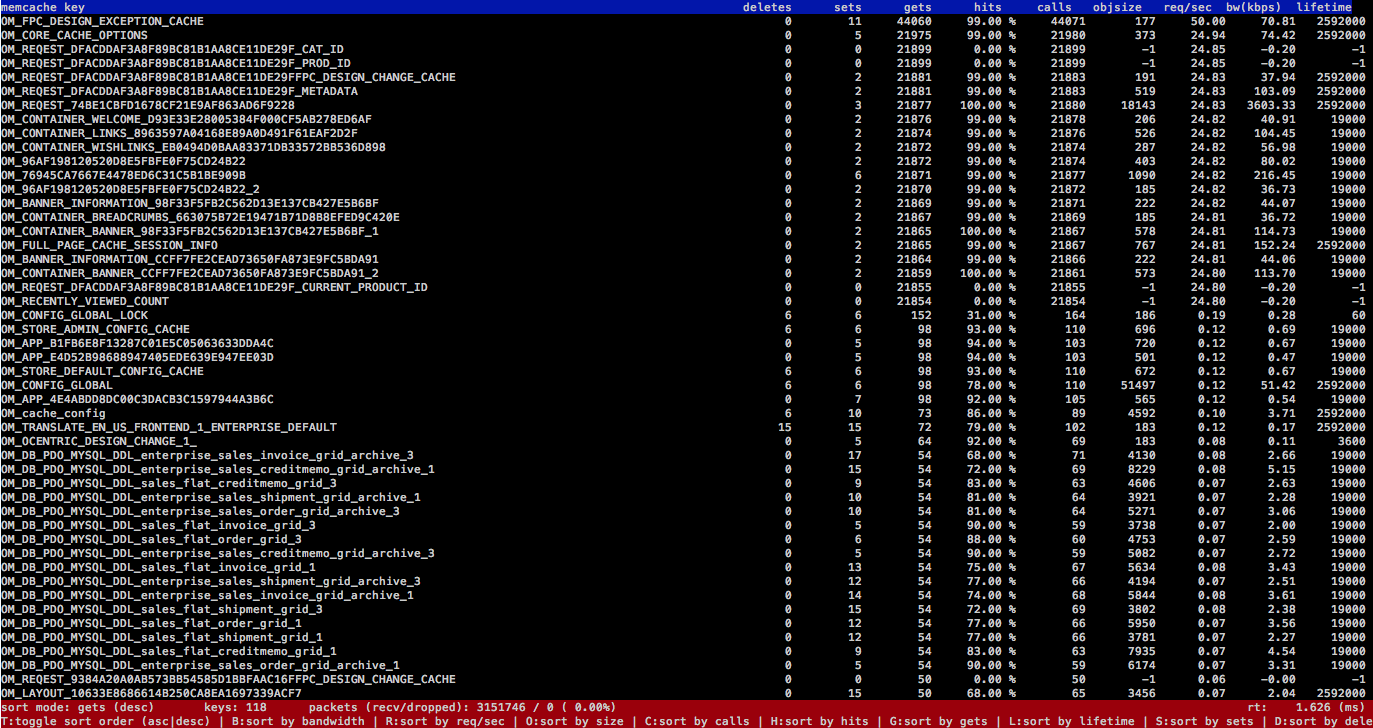
Inspired by "top", mctop passively sniffs the network traffic passing in and out of a server's network interface and tracks the keys responding to memcache get commands. The output is presented on the terminal and allows sorting by total calls, requests/sec and bandwidth.
You can read more detail about why this tool evovled over on our code as craft blog.
mctop depends on the ruby-pcap gem, if you don't have this installed you'll need to ensure you have the development pcap libraries (libpcap-devel package on most linux distros) to build the native gem.
mctop sniffs network traffic collecting memcache VALUE responses and calculates from
traffic statistics for each key seen. It currently reports on the following metrics per key:
- calls - the number of times the key has been called since mctop started
- gets - the number of times on get on that key since mctop started
- hits - hit rate on get requests since mctop started
- sets - the number of times on set on that key since mctop started
- deletes - the number of times on delete on that key since mctop started
- objsize - the size of the object stored for that key
- req/sec - the number of requests per second for the key
- bw (kbps) - the estimated network bandwidth consumed by this key in kilobits-per-second
- lifetime - expiration time of the key at the time it was set
the quickest way to get it running is to:
- ensure you have libpcap-devel installed
- git clone this repo
- in the top level directory of this repo
bundle install(this will install the deps) - then either:
- install it locally
rake install; or - run it from the repo (good for hacking)
sudo ./bin/mctop --help
- install it locally
Usage: mctop [options]
    -i, --interface=NIC              Network interface to sniff (required)
    -p, --port=PORT                  Network port to sniff on (default 11211)
    -d, --discard=THRESH             Discard keys with request/sec rate below THRESH
    -r, --refresh=MS                 Refresh the stats display every MS milliseconds
    -h, --help                       Show usage info
The following key commands are available in the console UI:
C- sort by number of callsG- sort by number of getsL- sort by lifetimeH- sort by number get hit rateS- sort by number of setsD- sort by number of deleteO- sort by object sizeR- sort by requests/secB- sort by bandwidthT- toggle sorting by ascending / descending orderQ- quits
The following details are displayed in the status bar
sort mode- the current sort mode and orderingkeys- total number of keys in the metrics tablepackets- packets received and dropped by libpcap (% is percentage of packets dropped)rt- the time taken to sort and render the stats
- 2012-12-14 - Now compatible with Ruby 1.8.x (tested on 1.8.7-p371)
from my testing the ruby-pcap native interface to libpcap struggles to keep up with high packet rates (in what we see on a production memcache instance) you can keep an eye on the packets recv/drop and loss percentage on the status bar at the bottom of the UI to get an idea of the packet
There is currently no support for the binary protocol. However, if someone is using it and would like to submit a patch, it would be welcome.
