-
Notifications
You must be signed in to change notification settings - Fork 792
Debugging
OpenGrok uses just the standard Java logging (so there are no worries with Log4J vulnerabilities). So, to specify a configuration, use the java.util.logging.config.file Java system property, which means running the respective Java process (whether that is indexer or the web app) with -Djava.util.logging.config.file=insert/the/location/of/your/logging.properties
Here's an example of dead simple configuration for indexer:
handlers = java.util.logging.FileHandler, java.util.logging.ConsoleHandler

org.opengrok.level = FINEST

java.util.logging.FileHandler.pattern = /opengrok/log/opengrok%g.%u.log
java.util.logging.FileHandler.append = false
java.util.logging.FileHandler.limit = 0
java.util.logging.FileHandler.count = 12
java.util.logging.FileHandler.formatter = org.opengrok.indexer.logger.formatter.SimpleFileLogFormatter

java.util.logging.ConsoleHandler.level = WARNING
java.util.logging.ConsoleHandler.formatter = org.opengrok.indexer.logger.formatter.SimpleFileLogFormatter
The point is that the file handler will log more verbose messages (down to the FINEST level) to a file (which is rotated), while the console handler will display just the WARNING log entries (and more serious) to the console.
To make the web application to emit more log messages, increase the log level in appropriate configuration file.
E.g. if running with Tomcat that stores the configuration under /var/tomcat/conf, append this line:
org.opengrok.level = ALL
to the /var/tomcat/conf/logging.properties file and make sure Tomcat is actually using this file - in Tomcat process' arguments, check for -Djava.util.logging.config.file=/var/tomcat/conf/logging.properties. Restart Tomcat so the changes are put into effect.
Simply insert a breakpoint in the Indexer code in your favourite IDE.
When running the indexer, add the following Java options:
-agentlib:jdwp=transport=dt_socket,server=y,address=8010,suspend=y
This will make the indexer to listen on the port 8010 until a debugger connects.
In Netbeans, select the Debug -> Attach Debugger from the menu and fill in the port number in the dialog window and click Attach.
Or, make given IDE add the Java arguments and connect the debugger automatically, e.g. in IDEA just select 'Debug...' from the Run menu and pick one of the configurations to run indexer.
In IDEA, in order to debug JSPs, you need the IDEA Ultimate edition (if you don't have the tomcat plugin enabled, enable it, also enable jsp pages support, restart Idea and reimport project). In Netbeans it should work out of the box. We will describe how to debug in IDEA here.
First, open the opengrok-web Maven project.
Start by going to the 'Run' menu, select 'Edit Configurations' and create one based on Tomcat server (local) template:
then go to the 'Deployments' tab and select add the opengrok-web.war Artifact:
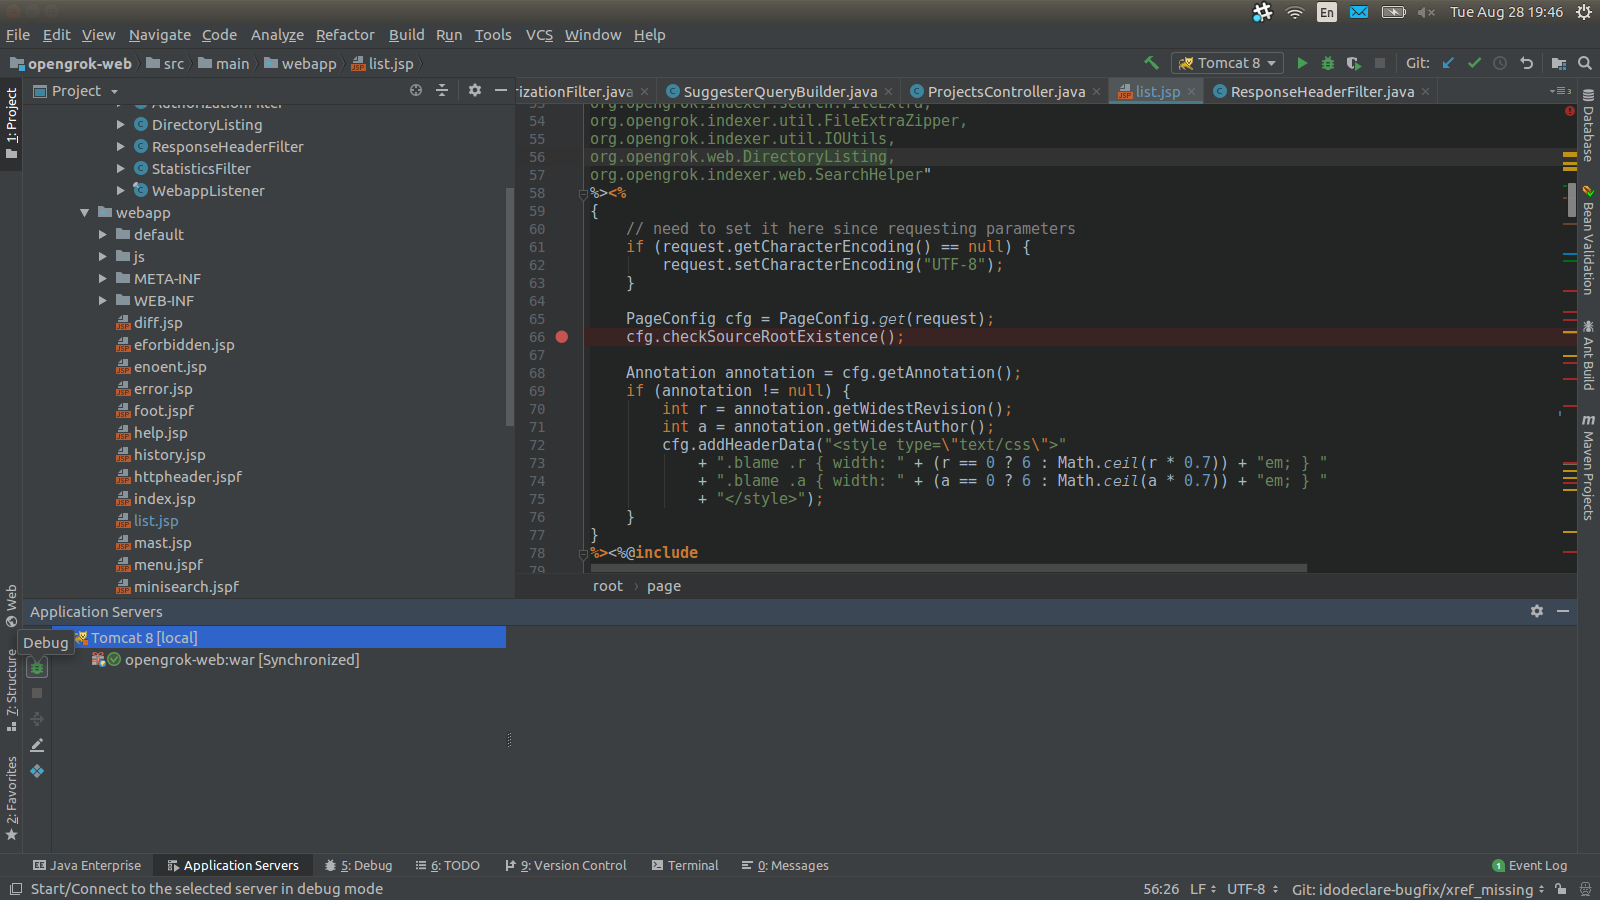
Then it is possible to start Tomcat via IDEA in debug mode by clicking on the small green bug icon (in the left bottom corner):
Once the server is up, IDEA will deploy the web application and open a browser window. It should be possible to insert breakpoints into JSPs:
The active breakpoints are marked by a little tickmark.
In order to descend into source code not present in the opengrok-web module, it is necessary to tell IDEA where the sources live, otherwise it will show decompiled source (click on the top bar displayed when going through decompiled sources).
Alternatively, to debug the web application the most generic way would be to add debug parameters to the application server. However, I could not get the following to work:
For Tomcat, create the bin/setenv.sh file with the following contents:
JAVA_OPTS="-agentlib:jdwp=transport=dt_socket,address=8010,server=y,suspend=n"Then restart Tomcat and then you can simply use remote debugging from your IDE, i.e. in IDEA in the 'Run' menu, select 'Attach to Process' and IDEA will offer process selection automatically:
For remote debugging in IDEA, go to the 'Run' menu, select 'Edit Configurations', add 'Remote JVM Debugging', choose the right port, select the opengrok module classpath, assign a name to the remote debugging target, hit 'Done'. Then from the 'Run' menu, choose "Debug 'whatever name was given to the remote target'".
In order to be able to debug JS code, the minification can be suppressed via the debug parameter in given request, e.g. http://localhost:8080/source/xref/Lucene/NOTICE.txt?r=072978999ca83be8efc725440b28b79a49147944&debug=true
For profiling an indexing run, JWDP is not required for a local ProcessAttach. It is convenient though to pause the run until the profiler is attached.
- Start an indexing run in a terminal for profiling:
$ OPENGROK_PROFILER=1 OpenGrok index --profiler
Loading the default instance configuration ...
Start profiler. Continue (Y/N)?
- Attach the NetBeans profiler from the menu: Profile -> Attach to External Process ... -> ... Already running local Java process.
- Continue the indexing run in the terminal by entering
Y. - After the run, NetBeans will present the analysis.
To disable minification of JavaScript, add debug=true request parameter.


