documentation wavefield_envelope
Our goal is to define the simulated wave field so that scenarios reflect the full range of conditions that may be encountered in the physical RobotX competition and are within capabilities of the VRX simulation.
For VRX we use the Pierson-Moskowitz wave spectrum sampling (PMS) model described in detail in the documentation (will show up once we merge the wave_visualization branch). The parameters of the wavefield model are user-specified within the ocean_waves model definition as SDF parameters for the WavefieldModelPlugin. For example:
<wave>
  <model>PMS</model>
  <number>3</number>
  <scale>1.5</scale>
  <steepness>0.0</steepness>
  <amplitude>0.1</amplitude>  <!-- No effect for the PMS model -->
  <period>2.0</period>
  <gain>1.0</gain>
  <direction>1.0 0.0</direction>
  <angle>0.4</angle>
  <tau>1.0</tau>
</wave>
The only parameters that will be varied are period, gain, direction and angle. The direction and angle parameters control the horizontal angles of the constituent waves and can vary over the full 360 degrees.
The range of allowable period and gain parameter limits were selected through empirical testing of the simulation to find suitable values to challenge the participants while remaining relevant to RobotX conditions.
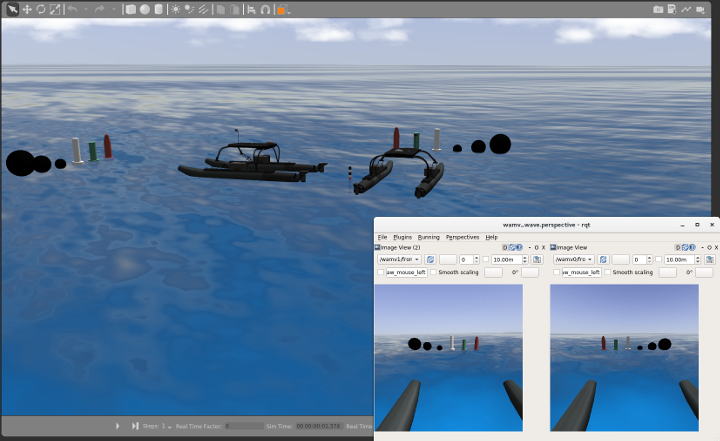
The testing setup is a custom ocean world with two WAM-V's (with cameras), a few of the markers and wavegauge (more on that below).
roslaunch wave_gazebo wave_wamv.launch verbose:=true paused:=true
which should result in a view similar to this.
Based on running the simulation in a variety of conditions, we arrive at the following envelope of acceptable wave field parameters for VRX evaluation.
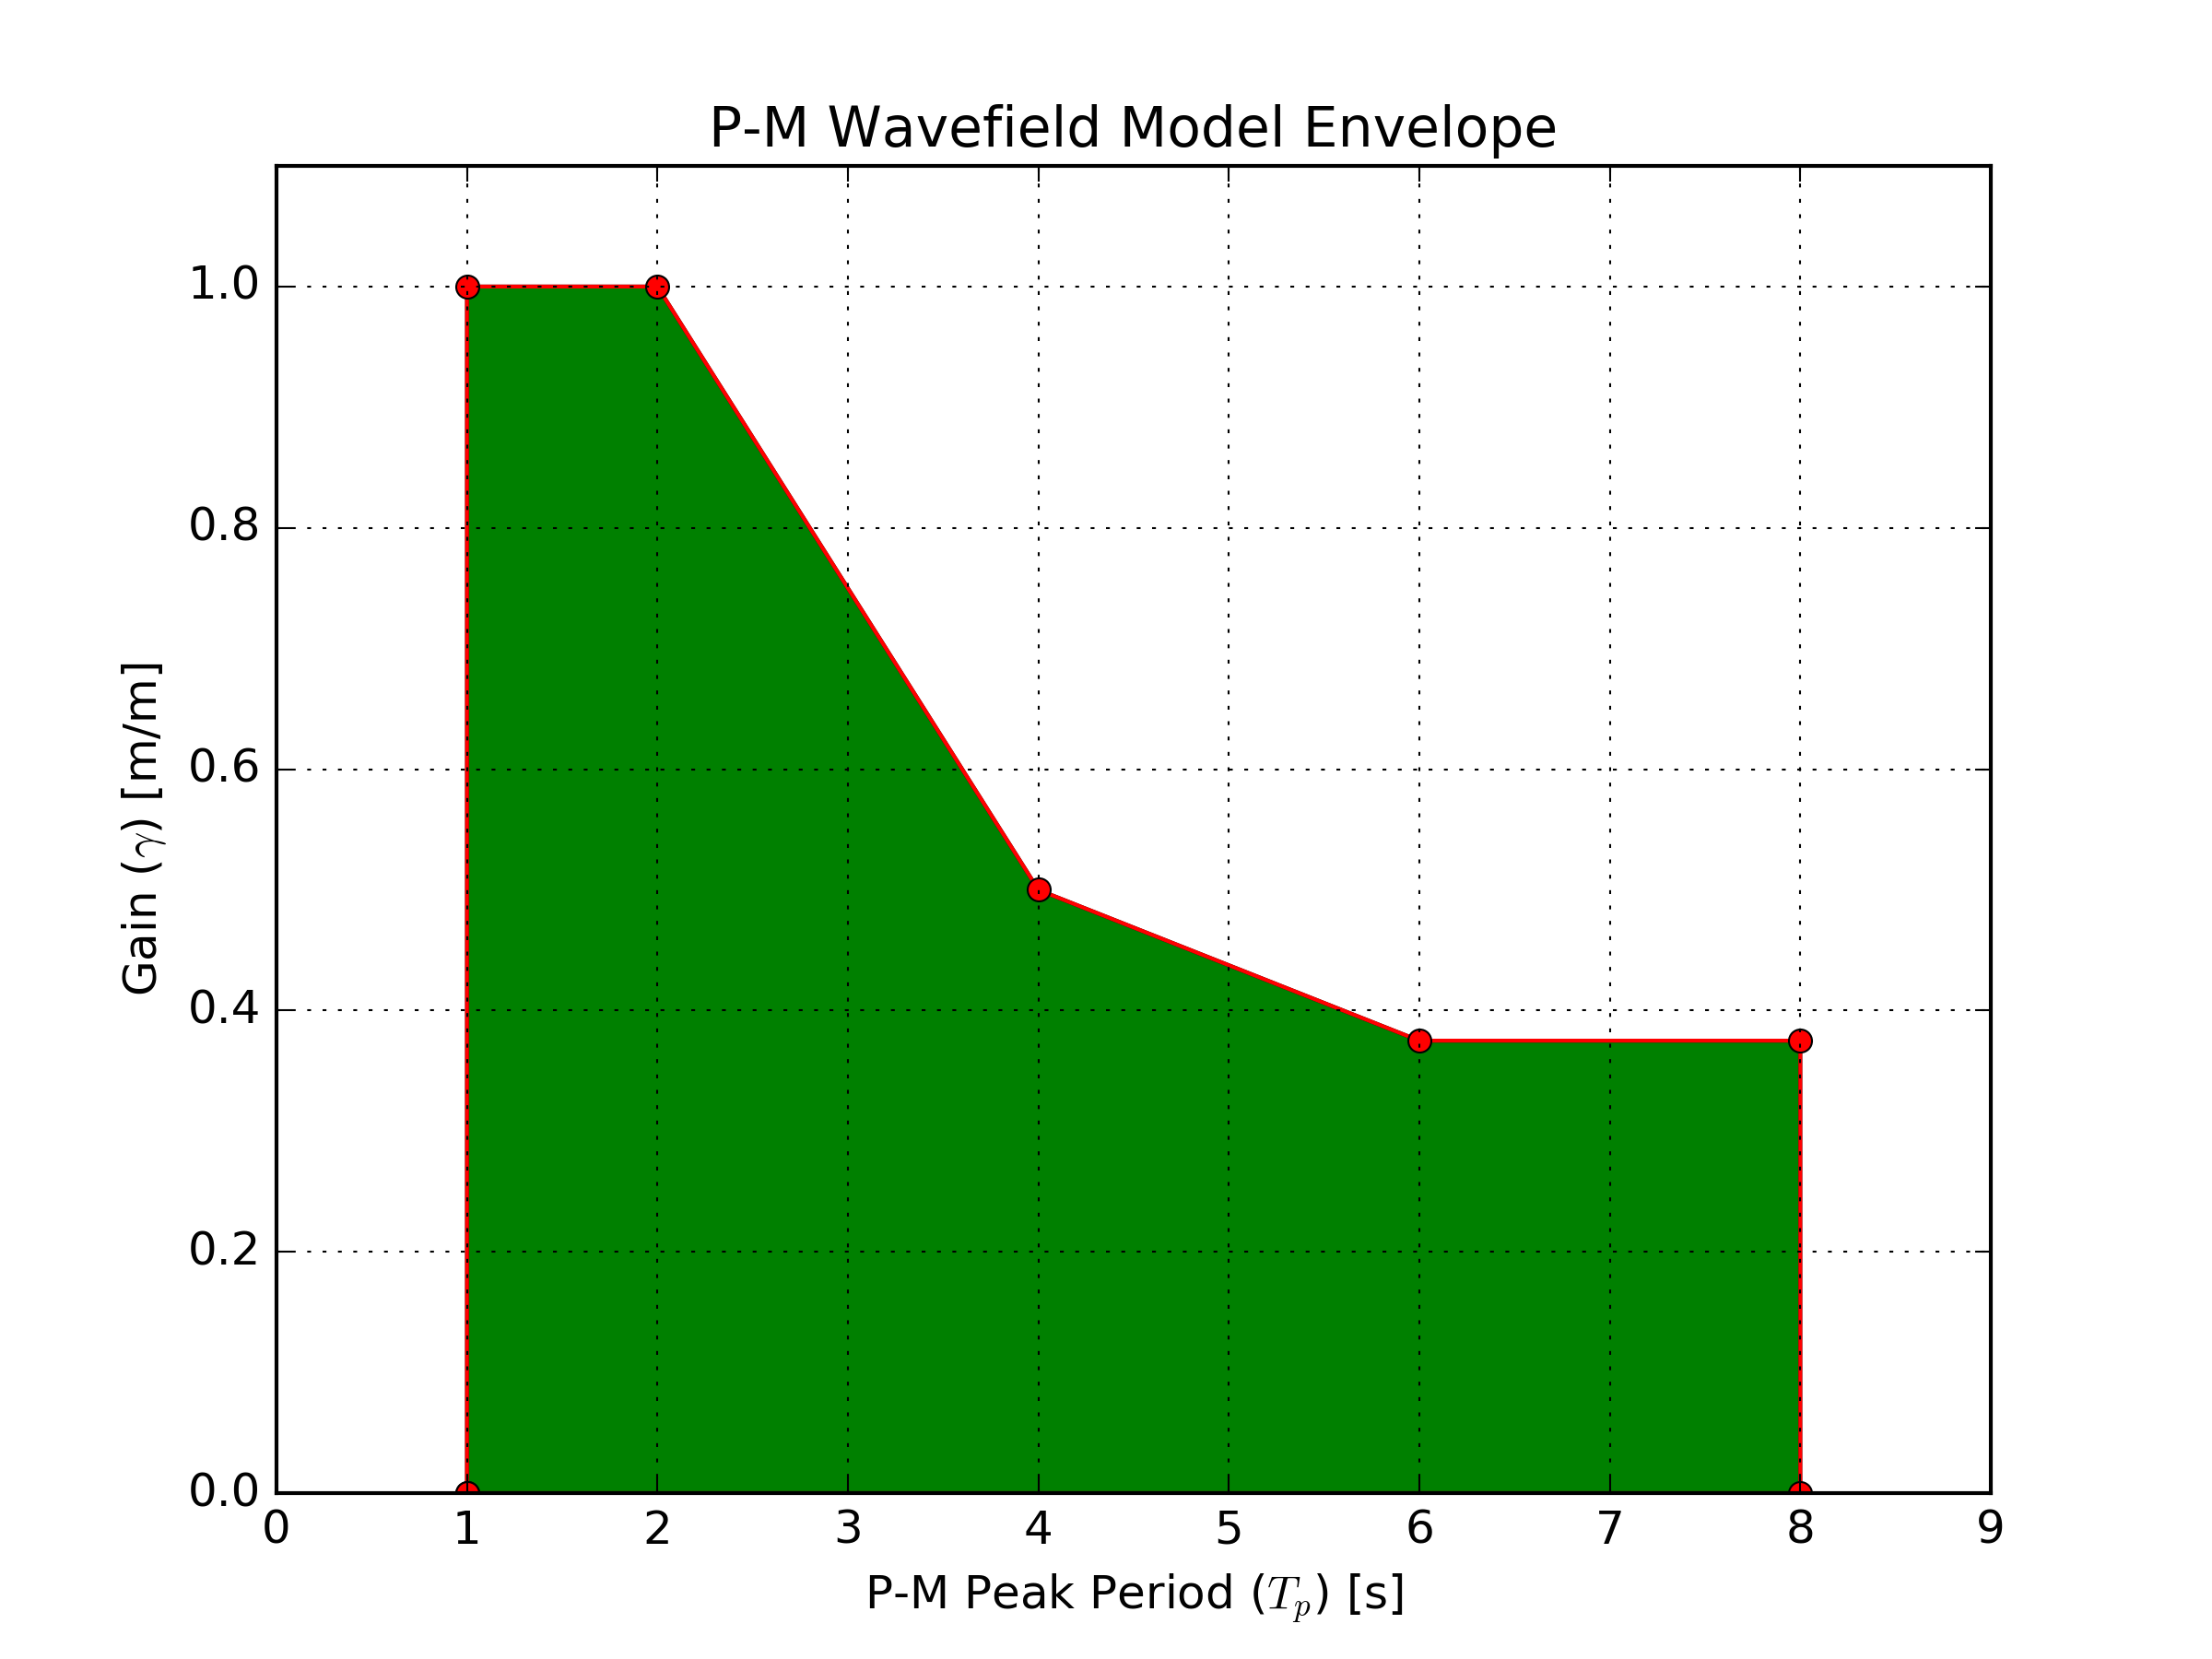
This video illustrates some of the wave conditions within the envelope.
The process for generating both the visual representation of the wave field and the physical forces associated with the waves is described at https://github.com/osrf/vrx/wiki/documentation-wavefield_generation
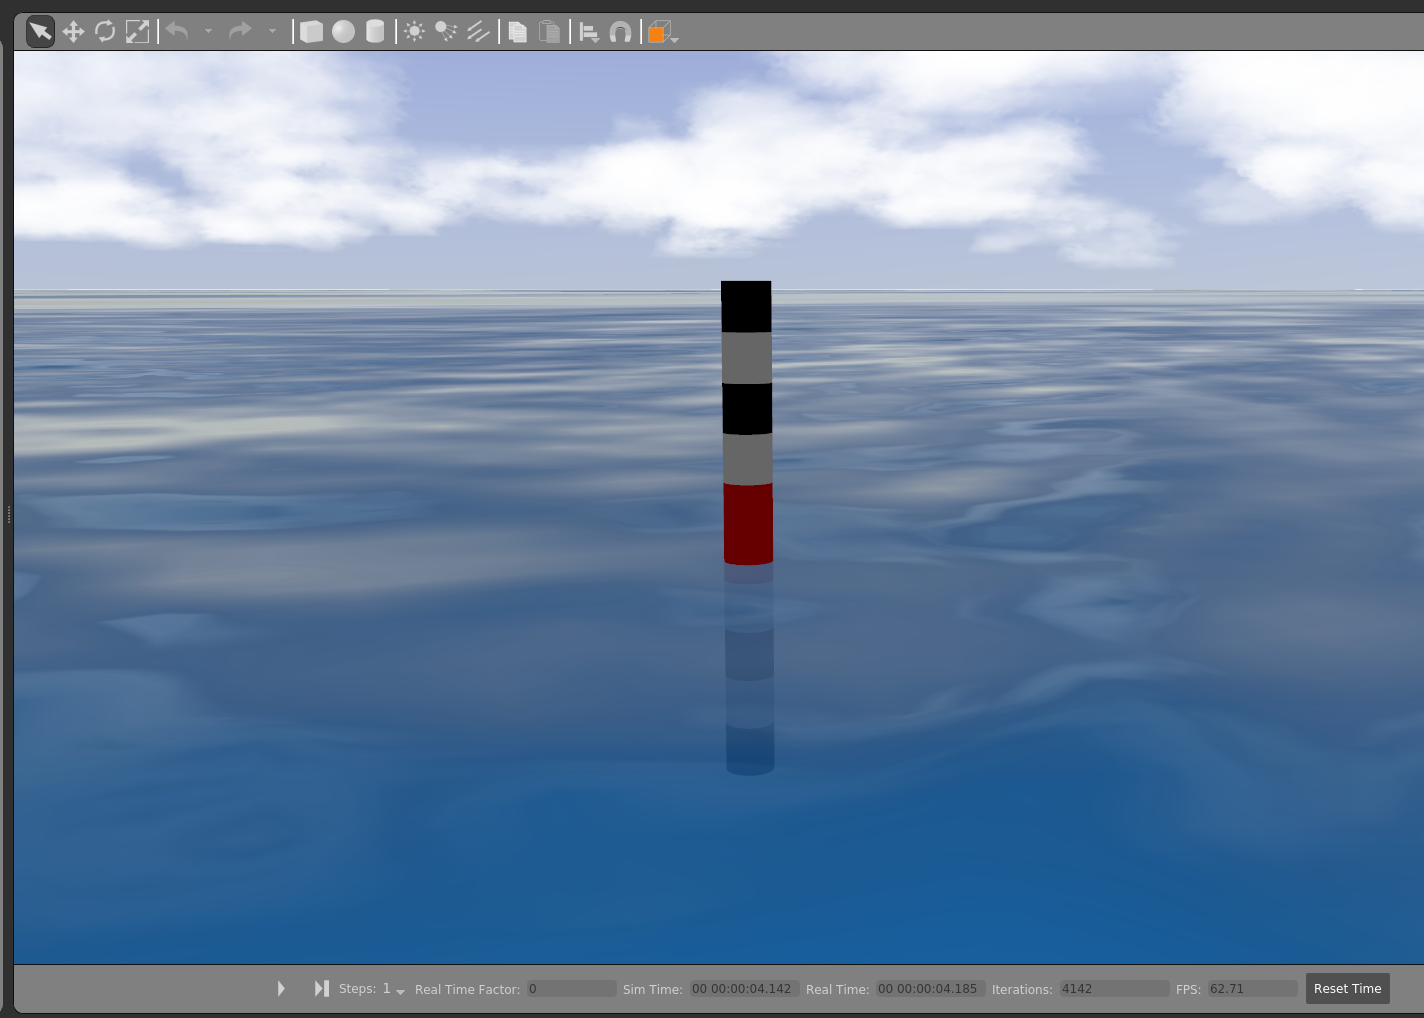
This method appears to work well low seastates, but as the ocean dynamics increase there are increasing differences between the visualization (which is important for simulated camera rendering) and the physical motion. One way that we have attempted to measure the differences is with a wavegauge plugin and visual model. The image below shows the wavegauge model. The center red section is 0.2 m long and each of the black and white sections is 0.1 m in length. The wavegauge plugin sets the position of this object to the current wave height as calculated by the wave model - the same model used to generate the physical forces. So, this model is an indicator of the physical wave height to enable visualizing the difference between the physical and visual wave height.
We can run a simple test
roslaunch wave_gazebo ocean_world_buoys.launch
with the wavefield period of 8.0 s and gain of 1.0. This results in three component waves with period/amplitude of 12.0/0.14, 8.0/0.7, 5.3/0.46.
In this video we can see that the physical wave height, as indicated by the wave gauge model, varies from the visual wave height by roughly +/-0.4 m. Note that this sea condition has the ocean surface with a wave height (peak to trough) of roughly 2.0 m which is much more than we expect for RobotX.