- Clearing Functions
- Canvas Utilities
- File Utilities
- Testing Tools
- Command Line Tool
- Colored Text
- Docstrings
Here are all the available clearing functions:
-
clear_figure(), in shortclf(), clears all internal definitions of the subplot it refers to, including its subplots, if present; If it refers to the entire figure, it will clear everything. -
clear_data(), in shortcld(), clears only the data information relative to the active subplot, without clearing all the other plot settings. -
clear_color(), in shortclc(), clears only the color settings relative to the active subplot, without clearing all other plot settings. The final rendering of this subplot will be colorless. This function is equivalent totheme('clear'). -
clear_terminal(), in shortclt(), clears the terminal screen and it is generally useful when plotting a continuous stream. If itslinesparameter is set to an integer, only the specified number of lines will be cleared: note that, depending on the shell used, few extra lines may be printed after the plot.
These functions are useful to save or change how the final result is outputted.
-
interactive(True)allows to plot dynamically without using theshow()method. A new plot is shown automatically when a change is made. -
build()is equivalent toshow()except that the final figure is returned as a string and not printed. -
save_fig(path)saves the colorless version of the plot, as a text file, at thepathspecified:- if the path extension is
.htmlthe colors will be preserved, - if
append = True(Falseby default), the final result will be appended to the file, instead of replacing it, - if
keep_colors = True(Falseby default), thetxtversion will keep the ansi color codes and in Linux systems, the commandless -R path.txtcan be used to render the colored plot on terminal.
- if the path extension is
plotext includes the following set of tools to easily manipulate files and file paths:
-
script_folder()returns the folder containing the script where it is run. -
parent_folder()returns the parent folder of thepathprovided, at thelevelabove specified. -
join_paths()joins as many strings into a proper file path. The~character will be interpreted as the user home folder. If no folder is provided, the home folder is considered by default. -
save_text()saves sometextto thepathspecified. -
read_data()reads numerical data from thepathspecified, using the givendelimiterbetween columns (by default the space character), selecting the specified list ofcolumns(starting from 1) and including or not the first data row with theheaderparameter. -
write_data()write a matrix of data at thepathspecified, with givendelimiterand considering the specifiedcolumns. -
transpose()simply transposes a matrix. -
download()downloads the content from the givenurlto thepathselected. -
delete_file()deletes the file at thepathspecified, if it exists.
Here are some tools useful to test the plotext package:
-
sin()outputs a sinusoidal signal with the givenperiods,length,amplitude,phaseanddecayrate. More documentation is available usingdoc.sin(). -
square()outputs a square wave signal with the given nperiods,lengthandamplitude. More documentation is available usingdoc.square(). -
test()to perform a quick plotting test (up to image rendering): it will download and finally remove a test image. -
time()returns the computation time of the latestshow()orbuild()function. -
A series of test files can be downloaded using the following url paths in conjunction with the
download()method:test_data_urlis the url of some 3 columns test data,test_bar_data_urlis the url of a simple 2 columns data used to test thebar()plot,test_image_urlis the url of a test image,test_gif_urlis the url of a test GIF image,test_video_urlis the url of a test video,test_youtube_urlis the url to a test YouTube video.
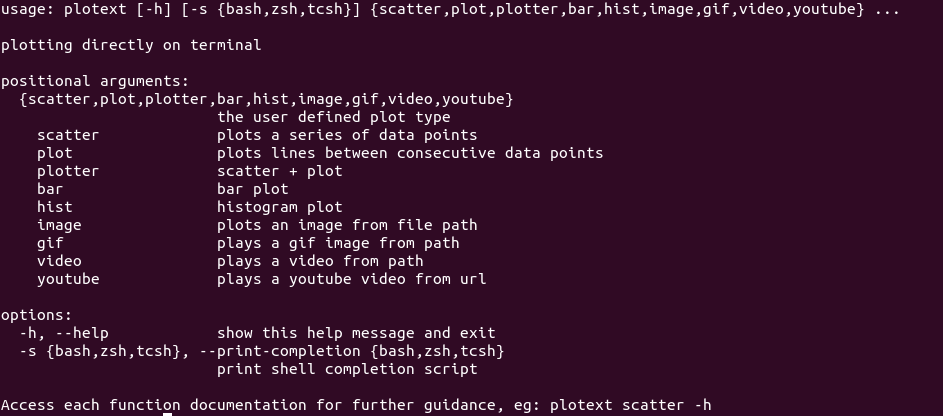
There are two ways one could use plotext directly on terminal. The first is by using its dedicated command line tool, to print a simple scatter, line, bar or histogram plot, as well as for image plotting, GIFs, video and YouTube rendering. For further documentation run, on terminal:
plotext --helpThe documentation of each function is also available. For example with:
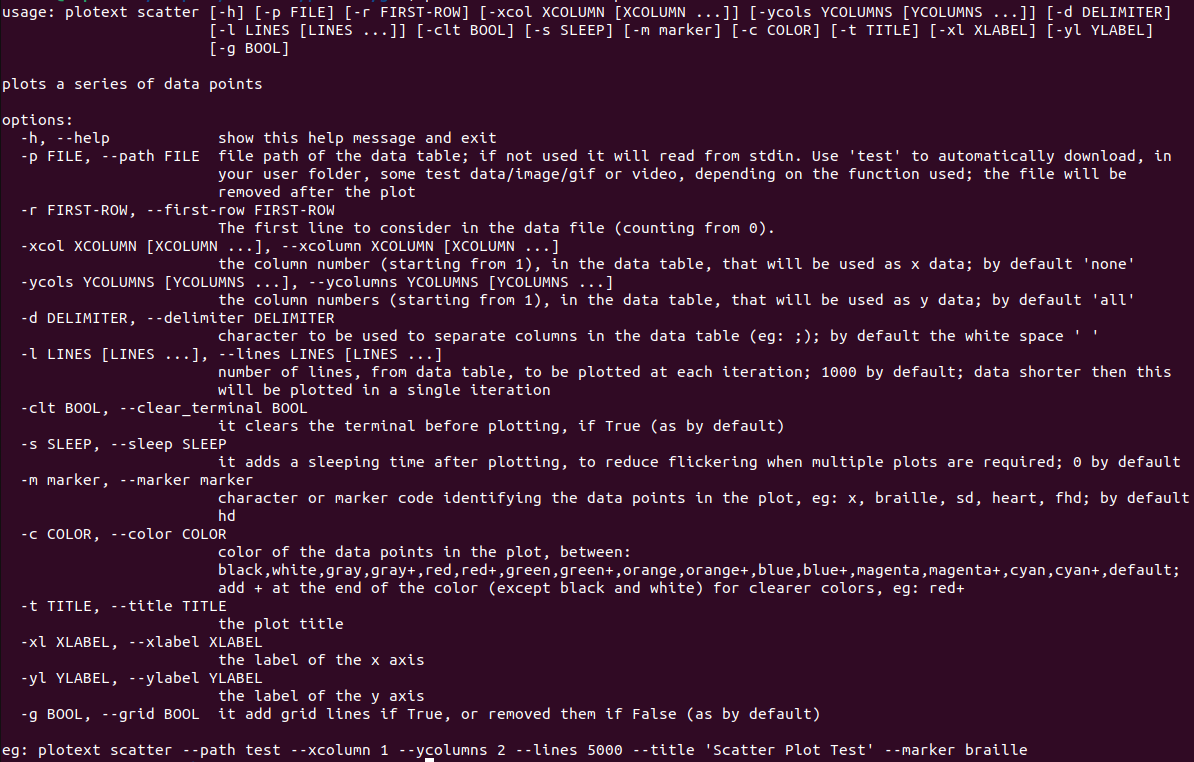
plotext scatter --help-
The
--pathoption is used to read from the specified path. -
The
--linesoption is used to plot a long data table at chunks of givenLINES(1000 by default). -
The tool recognizes the keyword
testas path, to internally downloads and finally remove some test file. Here are some example:plotext scatter --path test --xcolumn 1 --ycolumns 2 --lines 5000 --title 'Scatter Plot Test' --marker braille plotext plot --path test --xcolumn 1 --ycolumns 2 --sleep 0.1 --lines 2500 --clear_terminal True --color magenta+ --title 'Plot Test' plotext plotter --path test --xcolumn 1 --ycolumns 2 --sleep 0.1 --lines 120 --clear_terminal True --marker hd --title 'Plotter Test' plotext bar --path test --xcolumn 1 --title 'Bar Plot Test' --xlabel Animals --ylabel Count plotext hist --path test --xcolumn 1 --ycolumns 2 --lines 5000 --title 'Histogram Test' plotext image --path test plotext gif --path test plotext video --path test --from_youtube True plotext youtube --url test
-
you can type
python3 -m plotext(orpython -m plotextdepending on your system) instead ofplotexton your terminal, if the command tool is not directly available. -
to allow TAB completion, install
plotextwith flag[completion], as explained here. For issues on this feature, please report here.
The second way to use plotext directly on terminal requires the translation of a script into a single string and passing it to the python3 -c tool. For example:
import plotext as plt
plt.scatter(plt.sin())
plt.title('Scatter Plot')
plt.show()
translates into:
python3 -c "import plotext as plt; plt.scatter(plt.sin()); plt.title('Scatter Plot'); plt.show();"-
Each
pythonline has to terminate with a semi-colon;and not a new line. -
Strings should be surrounded by the single quote
', while the double quote"should be avoided.
Each coded example in this guide is followed by the correspondent direct terminal command line (of the second type).
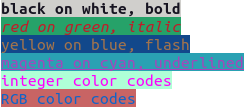
To obtained colored strings use the colorize() method, which paints a string with the given color, style and background color. If show = True the string is directly printed and not returned. Here are a few examples:
import plotext as plt
                                            #Fullground     #Style       #Background      #Show
plt.colorize("black on white, bold",        "black",        "bold",      "white",         True)
plt.colorize("red on green, italic",        "red",          "italic",    "green",         True)
plt.colorize("yellow on blue, flash",       "yellow",       "flash",     "blue",          True)
plt.colorize("magenta on cyan, underlined", "magenta",      "underline", "cyan",          True)
plt.colorize("integer color codes",         201,            "default",   158,             True)
plt.colorize("RGB color codes", (16, 100, 200), "default", (200, 100, 100), True)-
The available color codes are presented here, while the available styles here.
-
Using the
flashstyle will result in an actual flashing string. -
To remove any coloring use the
uncolorize()method.
All main plotext methods have a doc-string that can be accessed in three ways. For example the doc-string of the scatter() function can be accessed:
-
as usual, using
print(scatter.__doc__), for its uncolorized version, -
more easily through the
doccontainer, usingdoc.scatter(), for its colorized version, -
similarly with its internal .doc() method with
scatter.doc(), for its colorized version, -
with
doc.all()which prints allplotextcolorized doc-strings.
Here are some methods that directly output some useful plotext guides:
-
the
markers()method displays the available marker codes, also discussed here, -
the
colors()method displays the available color codes, also discussed here, -
the
styles()method displays the available style codes, also discussed here, -
the
themes()method displays the available themes, also discussed here.
Finally the platform string will return your OS (Unix or Windows) and version, the plotext version installed.


