Closed as not planned
Description
This is an example using px but I believe the core issue/feature would be resolved in Plotly.js. Happy to move this to https://github.com/plotly/plotly.py if that makes more sense.
import plotly.express as px
import pandas as pd

df = pd.DataFrame({"time": pd.date_range("2022-10-30 00:00:00", "2022-10-30 04:00:00", freq="1h", tz="Europe/Zurich")})
df["values"] = [1,1, 1, 2, 1, 1]
fig = px.line(df, x="time", y="values")
fig.show(“browser”)
Just for reference, since October 30th crosses daylight savings, this dataset will look like this:
                       time  values
0 2022-10-30 00:00:00+02:00       1
1 2022-10-30 01:00:00+02:00       1
2 2022-10-30 02:00:00+02:00       1
3 2022-10-30 02:00:00+01:00       2
4 2022-10-30 03:00:00+01:00       1
5 2022-10-30 04:00:00+01:00       1
Notice that there are two 2am's -- one at +02 and one at +01.
In this example, Plotly will render:

What you might expect instead is that it would have two 2ams on the x-axis, so our output would look more like a triangle.
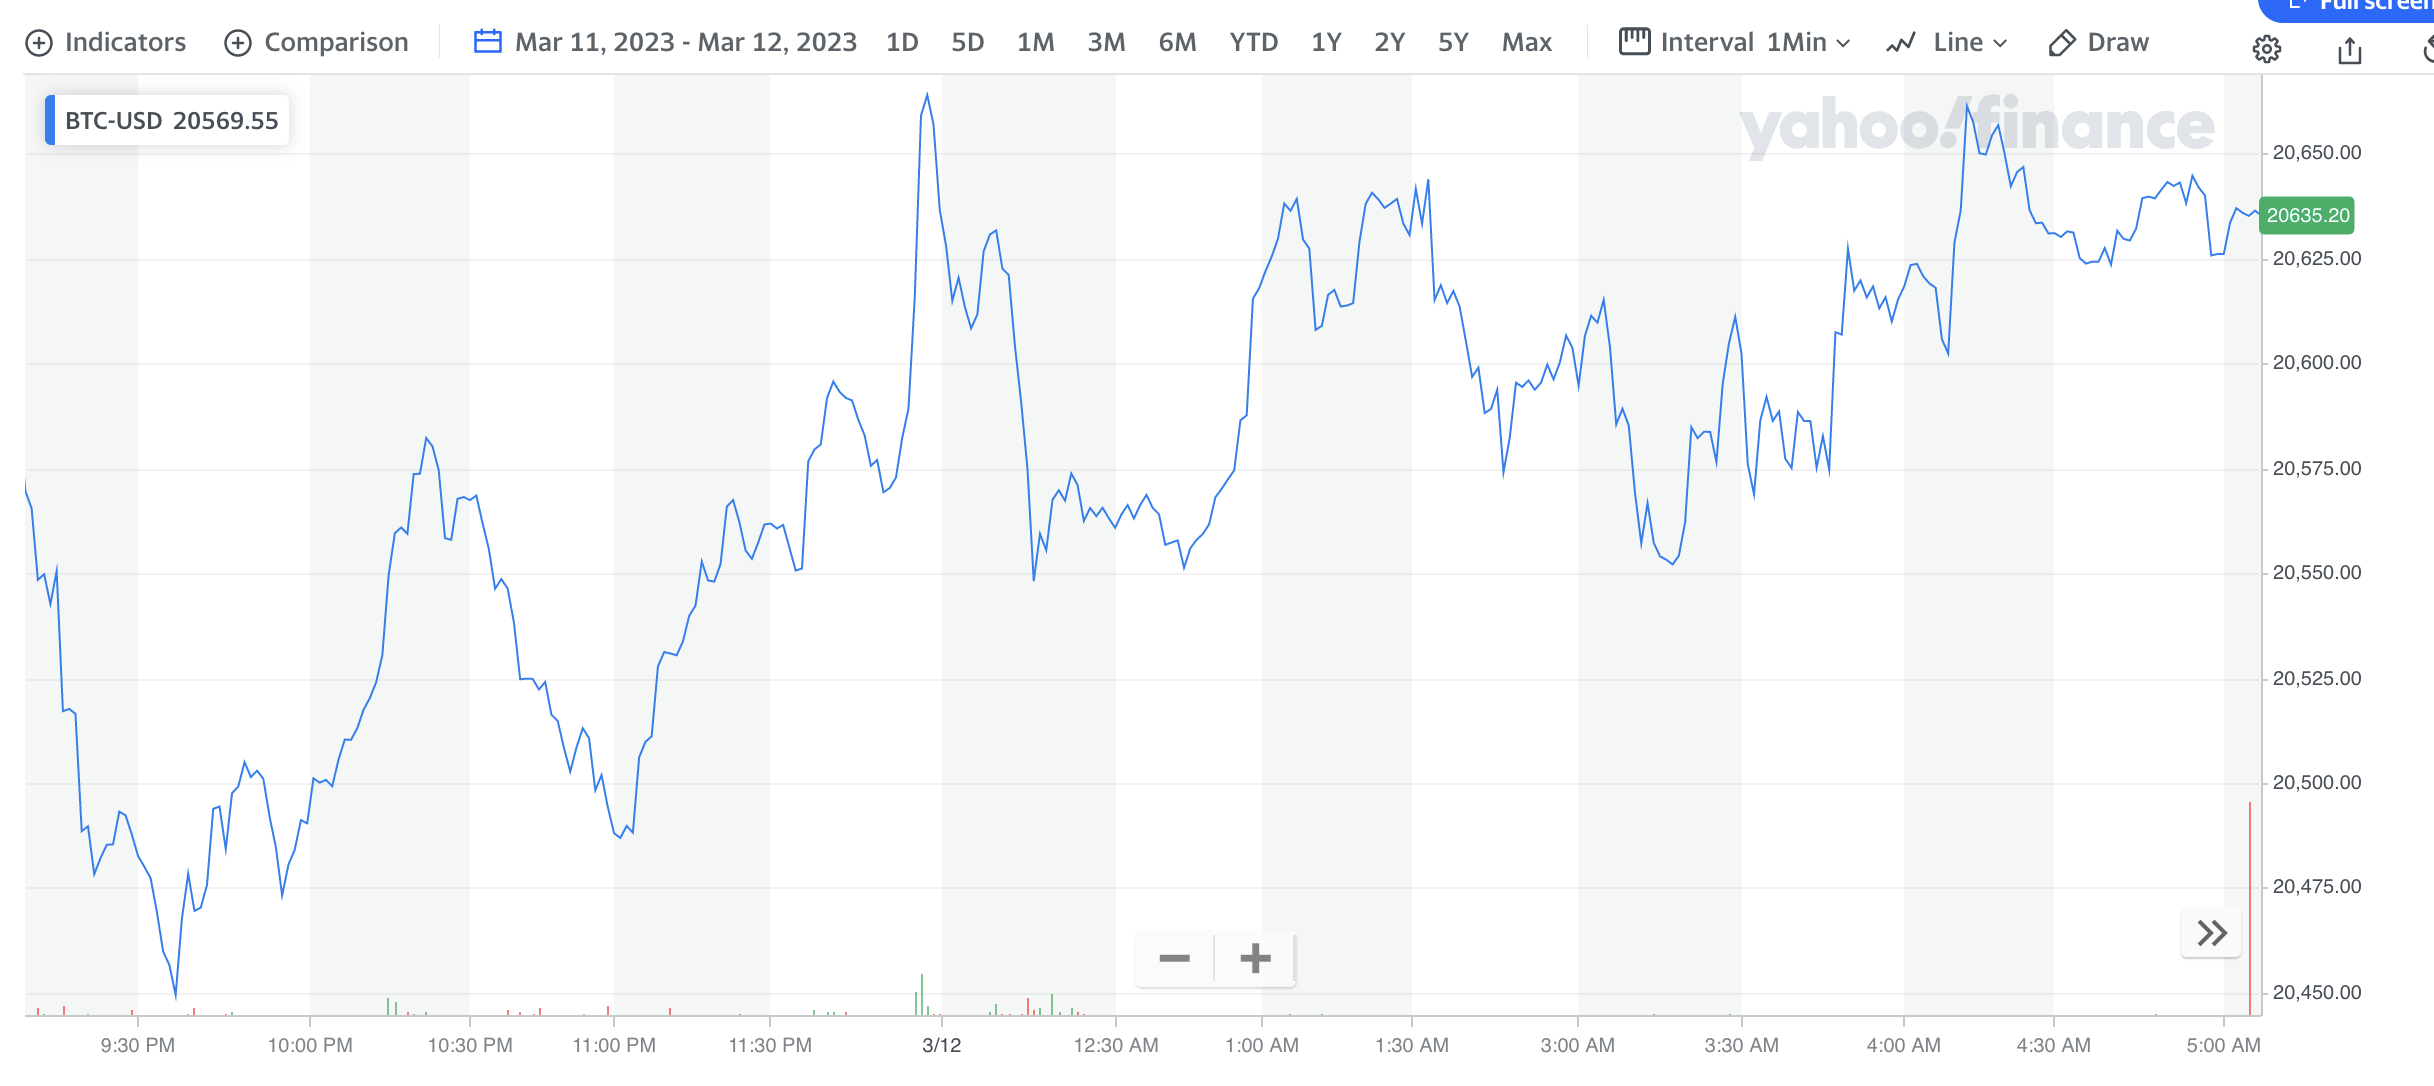
We can compare to this chart from Yahoo Finance, where we're doing daylight savings time (albeit in the other direction). Notice that 2am is never plotted here, but the data does not have a gap at 2am.