-
-
Notifications
You must be signed in to change notification settings - Fork 2.6k
go.FigureWidget does not autoresize in JupyterLab #2062
New issue
Have a question about this project? Sign up for a free GitHub account to open an issue and contact its maintainers and the community.
By clicking “Sign up for GitHub”, you agree to our terms of service and privacy statement. We’ll occasionally send you account related emails.
Already on GitHub? Sign in to your account
Comments
Did you get anywhere with this, and/or did you come up with a workaround? We've found that adding %%html
<style>
.jp-OutputArea-output {
overflow-y: hidden;
}
</style> to the top of notebook allows us to resize. For anyone joining this thread. The following is based on plotly The figure reacts to increasing/decreasing the size of the output: import plotly.express as px
fig = px.scatter(x=[0, 1, 2, 3, 4], y=[0, 1, 4, 9, 16])
fig.show() The figure reacts to increasing, but not decreasing (!!): import plotly.graph_objects as go
fig2 = go.FigureWidget()
fig2.add_trace(go.Scatter(x=[0, 1, 2, 3, 4], y=[0, 1, 4, 9, 16]))
fig2 This has the same behaviour as the first example, but cannot be used as part of ipywidgets: import plotly.graph_objects as go
fig2 = go.FigureWidget()
fig2.add_trace(go.Scatter(x=[0, 1, 2, 3, 4], y=[0, 1, 4, 9, 16]))
fig2.show() I.e. if we use the Output widget, it no longer reduces in size when the output area is reduced: import ipywidgets as widgets
import plotly.graph_objects as go
fig2 = go.FigureWidget()
fig2.add_trace(go.Scatter(x=[0, 1, 2, 3, 4], y=[0, 1, 4, 9, 16]))
out = widgets.Output()
with out:
fig2.show()
out |
Oh that's a pain - we don't use voila, so I've not encountered it - I guess have a poke around the stylesheet in the browser's Dev Tools to see if you can coerce the right behaviour? |
Hi @tfmark , I could not coerce the right behavior but even if I could, it does not solve the problem of when your |
Hi - we are trying to tidy up the stale issues and PRs in Plotly's public repositories so that we can focus on things that are still important to our community. Since this one has been sitting for a while, I'm going to close it; if it is still a concern, please add a comment letting us know what recent version of our software you've checked it with so that I can reopen it and add it to our backlog. Alternatively, if it's a request for tech support, please post in our community forum. Thank you - @gvwilson |
go.FigureWidget does not autoresize in JupyterLab
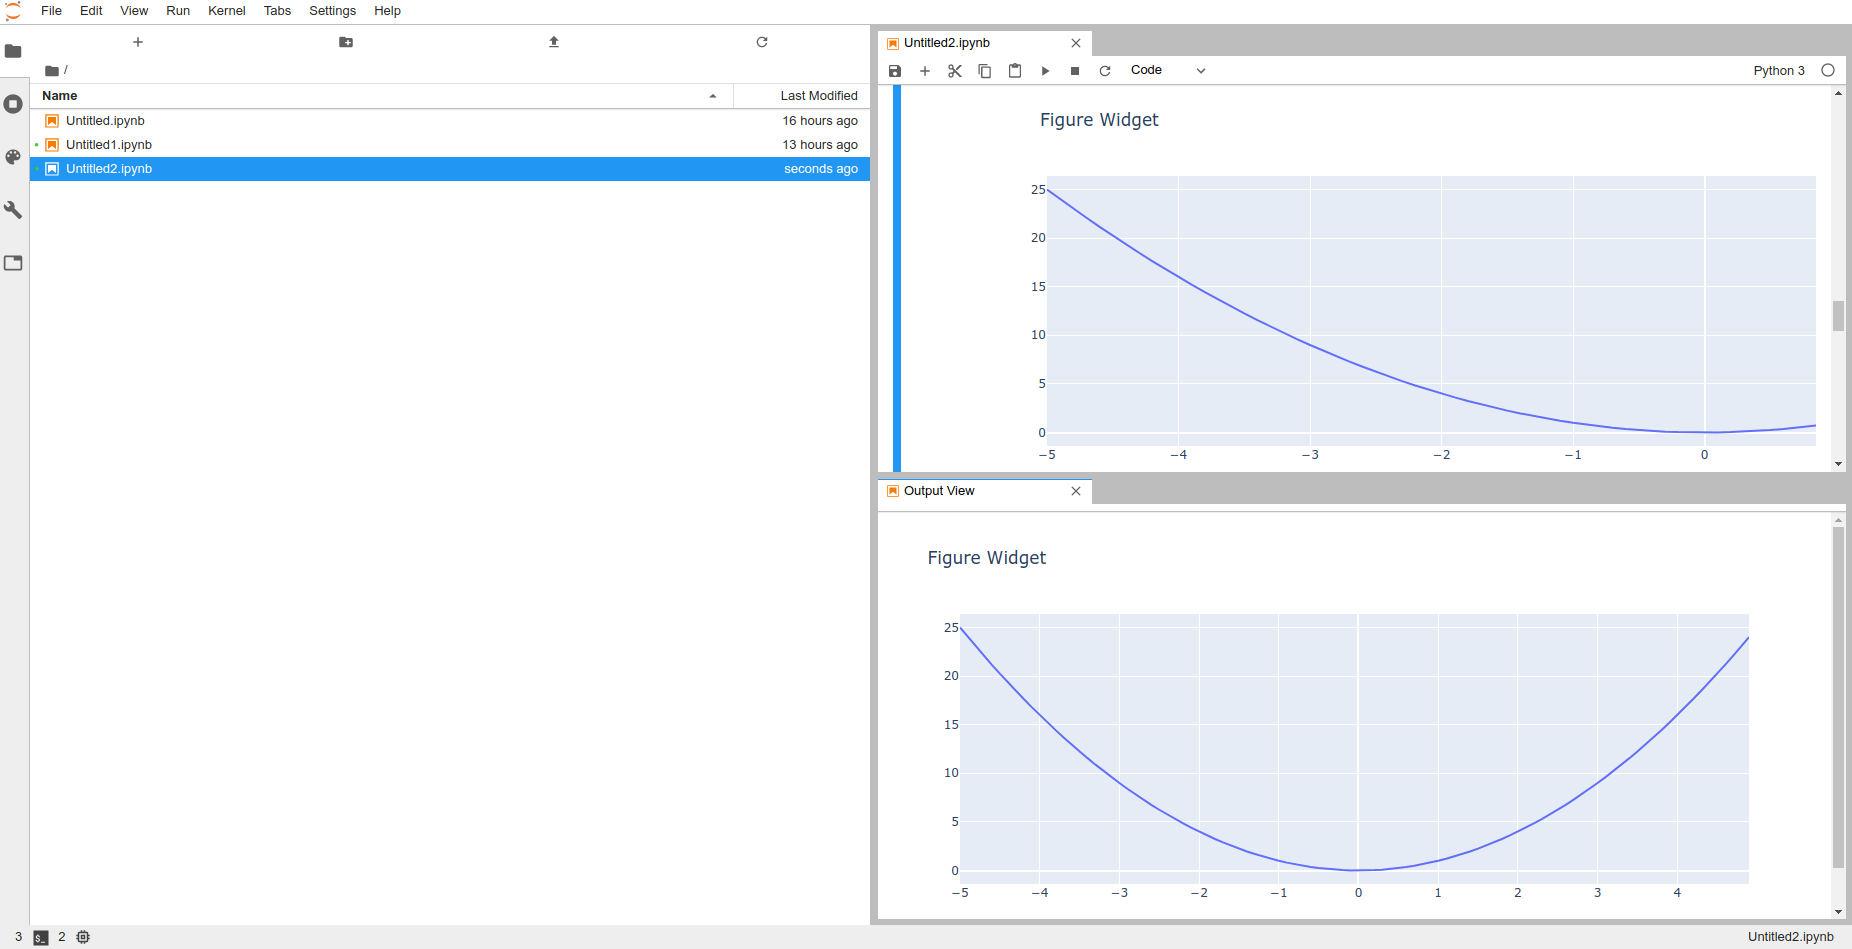
When creating a go.FigureWidget (in JupyterLab) and letting it display itself, it displays ok, but
when I resize the panes it does not resize. I have checked the value of fig.layout.autosize and it is equal to True.
Example:
import plotly.offline as pyo
import plotly.graph_objs as go
import numpy as np
x = np.arange(-5,5,0.1)
y = x ** 2
trace = go.Scatter(
x=x,
y=y,
mode='lines'
)
data = [trace]
layout = go.Layout(title='Figure Widget')
fig = go.FigureWidget(data=data, layout=layout)
fig
If I create a new view for the output of such FigureWidget, this view will resize perfectly when I resize the panes (as you can see in the attached image).
If instead of letting it display itself I display the FigureWidget using the .show method (fig.show()), this time it resizes perfectly when I resize the panes. However, this use-case does not fit my requirements because I would like to use the FigureWidget in combination with ipywidgets.
It is worth to mention that this behaviour does not happen when I use go.Figure, go.Figure resizes perfectly when I resize the panes.
Plotly and JupyterLab info:
plotly 4.4.1
JupyterLab v1.2.4
Known labextensions:
@jupyter-widgets/jupyterlab-manager v1.1.0 enabled OK
jupyterlab-dash v0.1.0-alpha.3 enabled OK
jupyterlab-plotly v1.4.0 enabled OK
plotlywidget v1.4.0 enabled OK
The text was updated successfully, but these errors were encountered: