3D cone has wrong color #2822
Description
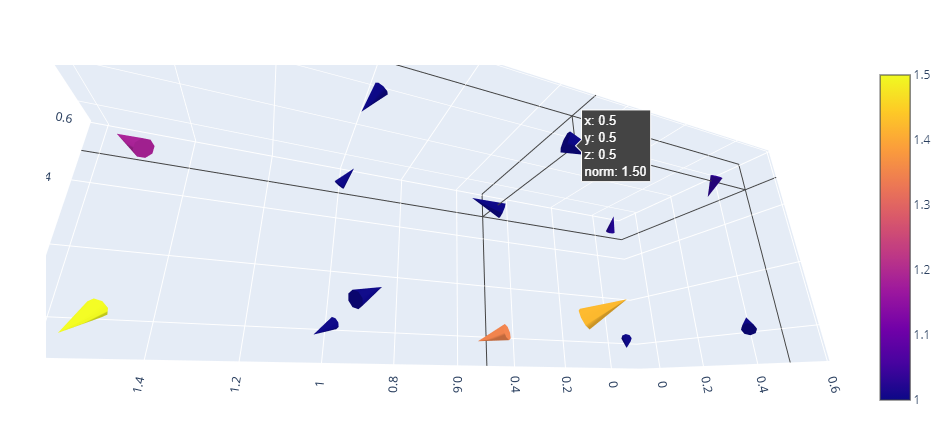
It looks like when using go.Cone the color is not always rendered correctly. See here for more info and below:
import plotly
print(plotly.__version__)
4.11.0
import plotly.graph_objects as go
import pandas as pd

df= pd.read_excel("vortexTest.xlsx")

fig3 = go.Figure(data = go.Cone(
    x=df['x'],
    y=df['y'],
    z=df['z'],
    u=df['u'],
    v=df['v'],
    w=df['w'],cmax=1.5,cmin=1
))

fig3.show()