3D Support for Streamline/Quiver Plots #861
Comments
|
3D
If your company is available to co-sponsor this effort, please reach out |

|
Im sorry, I guess I forgot to mention that I am using Python, is development for the above for JS AND Python platforms? If development for Python platform is happening currently, where might I access the source code? |
|
@SterlingButters the Python platform is simply an interface to the JS platform, so everything developed in Plotly.js you get for free as a Python user. |
|
Ahhh I see, so as I understand, cone plots and streamtubes are not in the current Plotly 2.1.0 release so how might I obtain them? Are they just hidden in GitHub somewhere and I just cant seem to find them? |
|
I apologize, I should have been more clear - these charts are in development in a private project. They won't be added to plotly.js (and thus plotly.py) until early next year. I just wanted to let you know that these charts are currently in active development, but are not available for early access yet. |
|
No problem, I guess it's a good thing they are in development at least. By early next year do you mean ~January 2018? Is early access a popular thing for in-development features? |
Probably more like March realistically.
Not really. If you're at a company and need to speed this along, we have programs for that, but otherwise it's just not a big priority now unfortunately. Thanks for your interest! I'll keep this issue open and updated as things progress. |
|
Awesome! thank you for your time in answering my questions :) |
|
Is this still going to be released soon? |
|
Yes. Uniform grids work great, but we're currently trying to improve the
output for *nonuniform* grids. Expect an update in 3 weeks.
…On Mon, Mar 5, 2018 at 2:47 PM, Zach Dwiel ***@***.***> wrote:
Is this still going to be released soon?
—
You are receiving this because you commented.
Reply to this email directly, view it on GitHub
<#861 (comment)>,
or mute the thread
<https://github.com/notifications/unsubscribe-auth/ABx4arwZITqX49D5i1CCZzPmufey5vEKks5tbZZVgaJpZM4P_9iB>
.
|
|
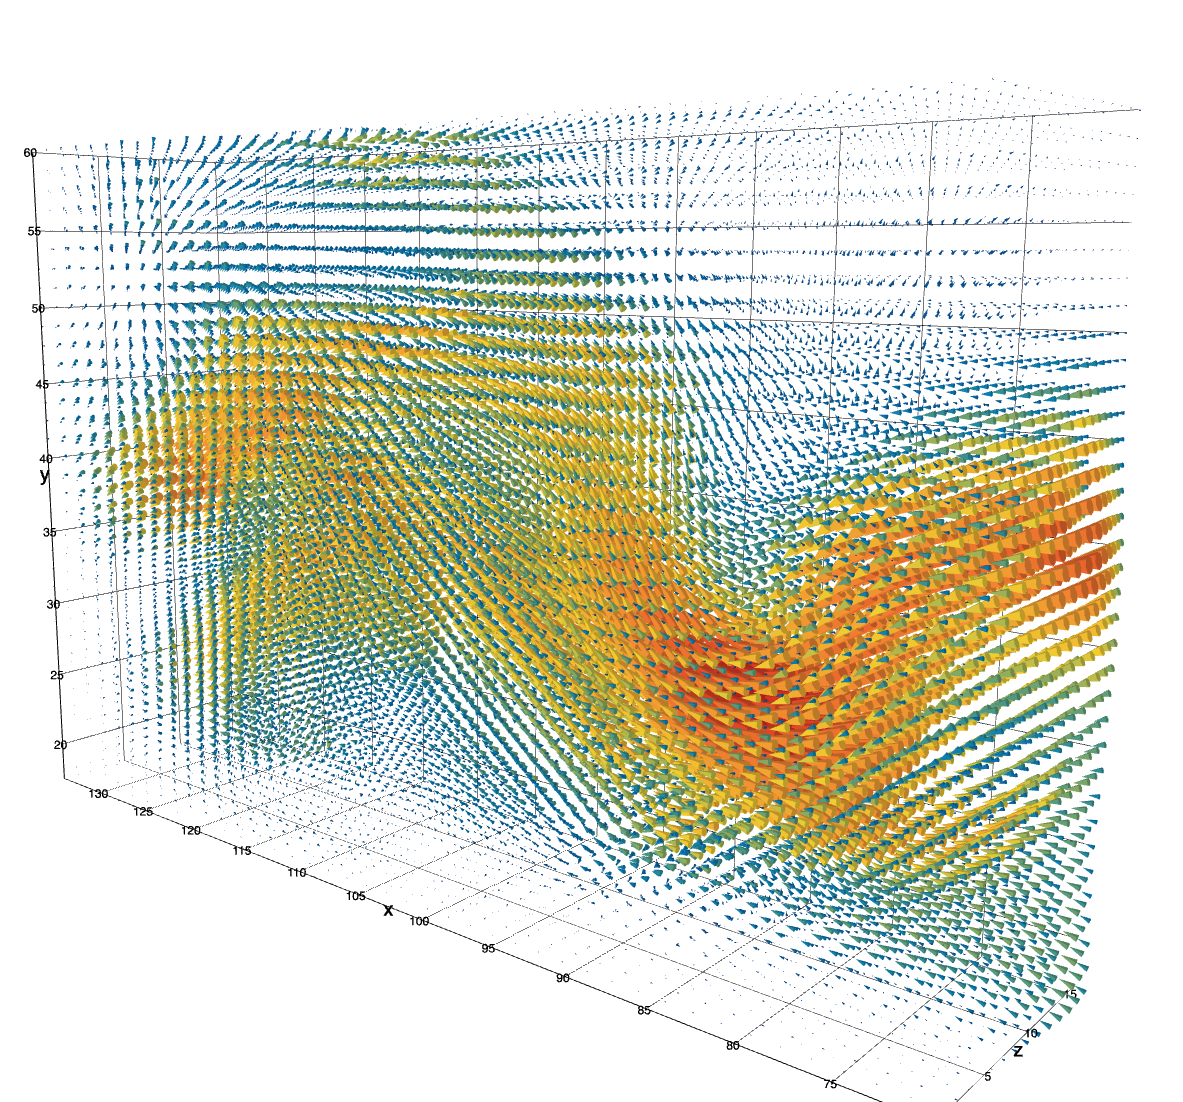
Many thanks for plotly, I discovered it one year ago and use the 3d plot functionality in Jupyter notebook. I am looking for the 3d quiver functionality to explore the last Gaia data release (see https://gea.esac.esa.int/archive/). I am not sure that you can expect a lot of money from the astronomer community but some enthusiastic users yes ;-) |
|
Folks interested in 3d quiver plots should follow updates here: plotly/plotly.js#2641 |
|
@zach-nervana @bombrun @SterlingButters
@empet has example usage on her Plotly profile: Streamlines and tubes will be released next week or the week after. Please subscribe to this PR for updates: Looking forward to see what you make. Closing this issue in lieu of plotly/plotly.js#2658 |

|
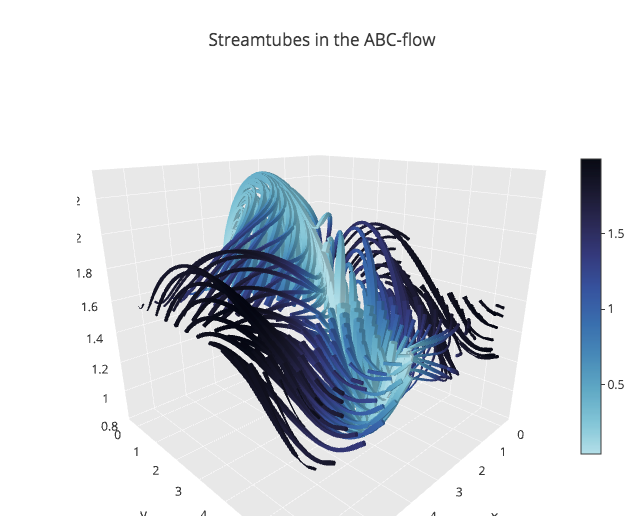
Streamtubes are now released: Python: https://plot.ly/python/streamtube-plot/
|
Is subject line easily implementable or might it currently be in development?
The text was updated successfully, but these errors were encountered: