Introduction
The Cyber Threat Intelligence Repository of MITRE ATT&CK™ contains loads of valuable information on:
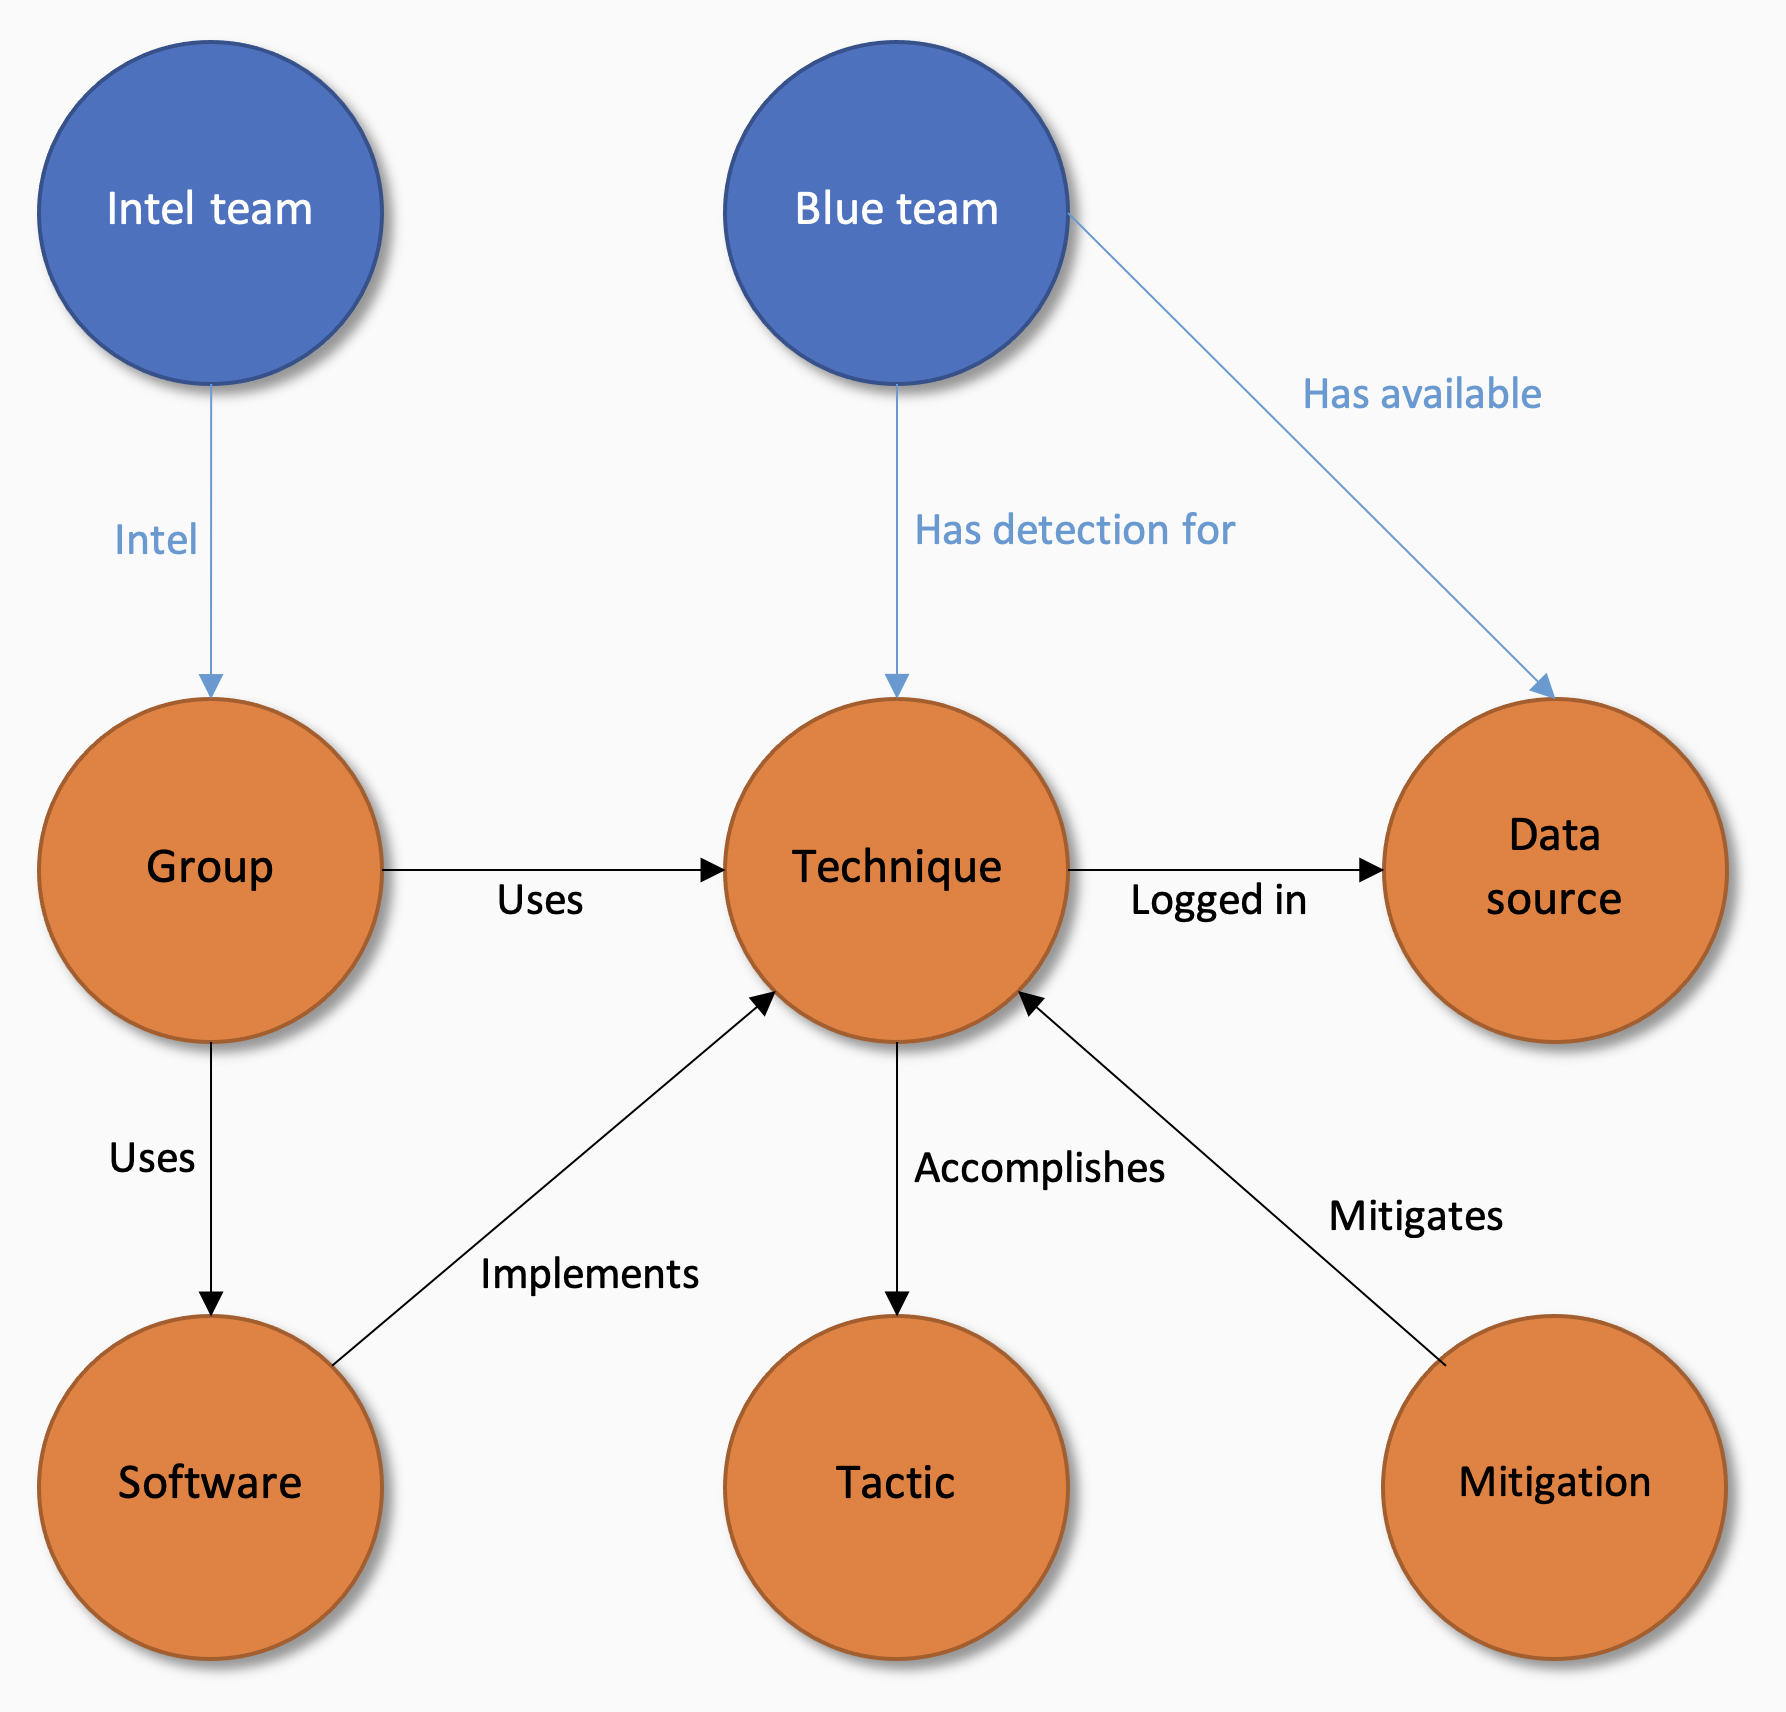
- TTPs (Tactics, Techniques and Procedures)
- Groups (threat actors)
- Software (software used by threat actors)
- Data sources (visibility required for detection)
- Mitigations (Not natively supported, yet, in DeTT&CT. In the meantime, it is possible to record this in custom YAML key-value pairs.)
The relationship between these types of information can be visualised using the following diagram:
You can map the information you have within your organisation on the objects available in ATT&CK. DeTT&CT delivers a framework that does exactly that, and it will help you administrate your blue team's data sources (including data quality), visibility, and detections. It will also provide you with means to administrate threat intelligence that you get from your intelligence team, a third-party provider or shared within the community. This can then also be compared to your current detection or visibility coverage. Or you could even choose to compare different sets of threat intelligence.
DeTT&CT administrates all this information within different YAML files, and a scoring table is provided to have a standardised way of scoring your data quality, visibility and detections. A Python tool is used (dettect.py) to generate different kind of output:
- ATT&CK Navigator layer files
- Excel files
- Graphs
For example, DeTT&CT can generate a layer file for the ATT&CK Navigator, which shows you your visibility and detection coverage, or techniques and software used by certain threat actors.
For layer files created by DeTT&CT, we recommend using this URL to the Navigator as it will make sure metadata in the layer file does not have a yellow underline: https://mitre-attack.github.io/attack-navigator/#comment_underline=false&metadata_underline=false