![]()
![]()


EOmaps is a python package to visualize and analyze geographical datasets.
It is built on top of matplotlib and cartopy and aims to provide an intuitive and easy-to-use interface to speed up and simplify the creation and comparison of maps.
- Visualize small datasets as well as millions of datapoints
- Handle 1D and 2D datasets with the same interface and create plots from NetCDF, GeoTIFF or CSV files
- Take care of re-projecting the data
- Compare, combine or (transparently) overlay multiple plot-layers
- Turn the maps into interactive data-analysis widgets with a few lines of code
- Provide a versatile set of tools to customize the maps (Features, WebMaps, Markers, Annotations etc.)
- Simplify the process of composing multiple maps (and other plots/images) in a single figure
- Export high resolution images (png, jpeg etc.)
To install EOmaps (and all its dependencies) via the conda package-manager, simply use:
conda install -c conda-forge eomaps... to get a huge speedup, use mamba to solve the dependencies!
conda install -c conda-forge mamba
mamba install -c conda-forge eomaps
Need more information?
- Have a look at the 🐛Installation instructions in the docs.
- Checkout the quickstart guide 🚀 From 0 to EOmaps.
Make sure to have a look at the 🌳 Documentation 🌳 which provides a lot of 🌐Examples on how to create awesome interactive maps (incl. 🐍 source code)!
Did EOmaps help in your research?
Support the development and add a citation to your publication!
Found a bug or got an idea for an interesting feature?
Open an issue or start a discussion, and I'll see what I can do!
Interested in actively contributing to the library? Awesome!
- Any contributions are welcome!
- New features (or ideas for new features)
- Enhancements for existing features
- Bug-fixes, code-style improvements, unittests etc.
- Documentation updates
- Outreach (e.g. blog-posts, tutorials, talks ... )
- Have a look at existing Issues or this 🌟 overview project to see where EOmaps could use your help.
- Get in touch by opening a discussion in the 🐜 Contribution section!

|
|

|

|

|

|
|

|

|
|
Checkout the 🚀 Basics in the documentation!
from eomaps import Maps
import numpy as np
# --- Create some random data
x, y = np.meshgrid(range(-50, 40, 5), range(-20, 50, 3))
data = np.random.randint(-100, 100, x.shape)
### Initialize Maps object
m = Maps(layer="all", crs=Maps.CRS.Orthographic(), figsize=(12, 8))
m.add_feature.preset.coastline() # Add a map-feature from NaturalEarth
### Plot a dataset
m_data = m.new_layer("data") # create a new layer
m_data.set_data(data=data, x=x, y=y, crs=4326) # assign a dataset
m_data.set_shape.ellipses() # set how to represent the data-points
m_data.set_classify.FisherJenks(k=6) # classify the data
m_data.plot_map(cmap="viridis", vmin=-100, vmax=100, set_extent=False) # plot the data
m_data.add_colorbar(hist_bins="bins", label="What a nice colorbar") # add a colorbar
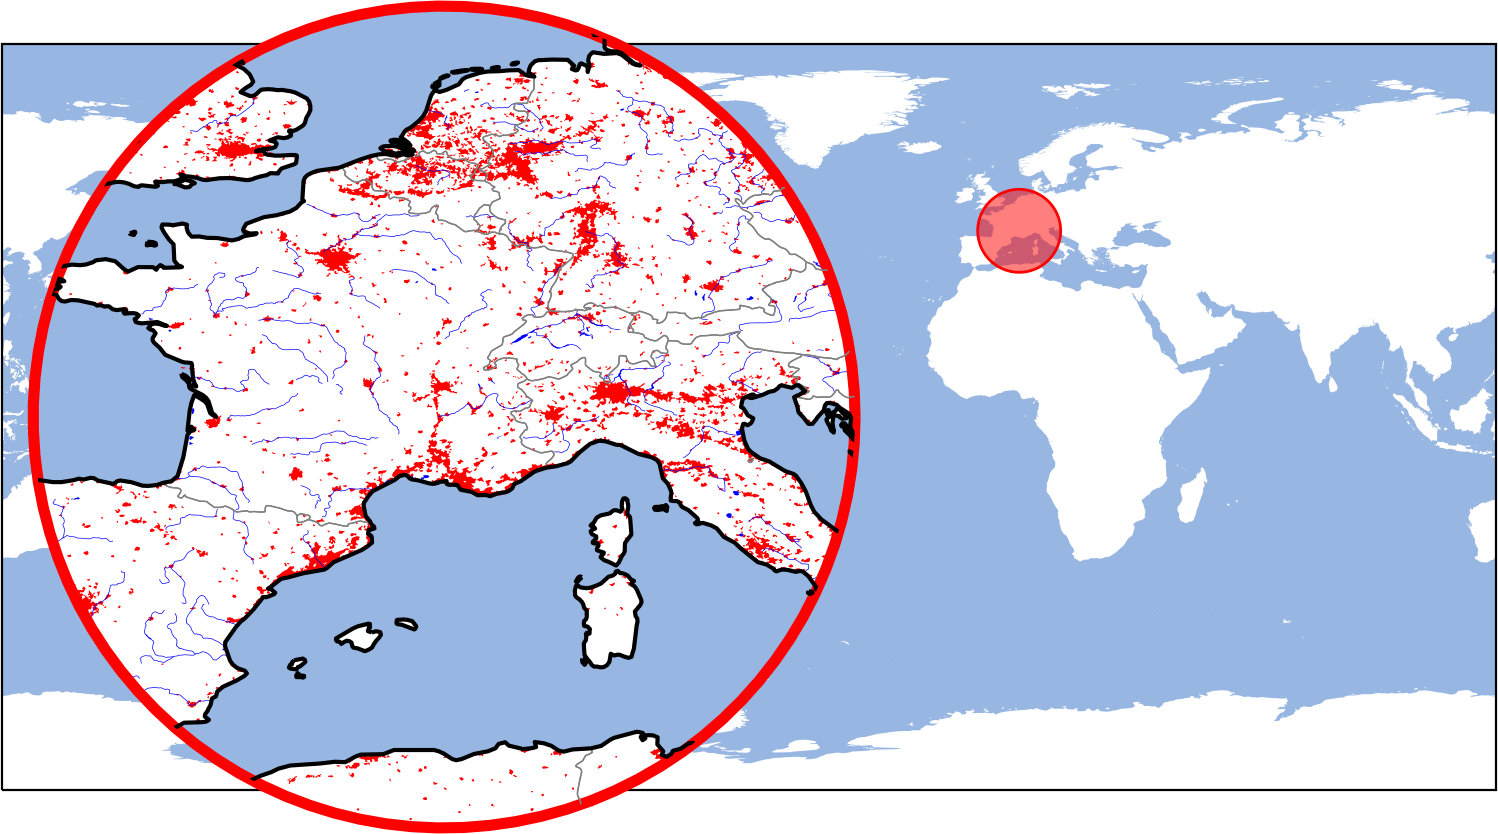
### Add zoomed-in "inset-maps" to highlight a specific area on th map
m_inset = m.new_inset_map((10, 45), radius=10, layer="data", plot_position=(.2, .6))
m_inset.inherit_data(m_data) # inherit the data
m_inset.inherit_classification(m_data) # inherit the classification
m_inset.plot_map(zorder=1) # plot the data on the inset-map as well
m_inset.add_feature.preset.ocean(zorder=2) # overlay some features from NaturalEarth
m_inset.add_feature.preset.coastline(zorder=3)
### Add imagery from open-access WebMap services
m_inset.add_wms.OpenStreetMap.add_layer.stamen_watercolor()
### Add a scalebar
s = m_inset.add_scalebar(lon=15.15, lat=44.45,
autoscale_fraction=.4,
scale_props=dict(n=6),
label_props=dict(scale=3, every=2),
patch_props=dict(lw=0.5, fc="w"))
### Add a compass (or north-arrow)
c = m_inset.add_compass(pos=(12.2, 51.6), pos_transform="lonlat")
### Compare and analyze multiple plot-layers
m2 = m.new_layer(layer="ocean") # create another layer
m2.add_feature.preset.ocean() # populate the layer
# ... or use the (layer argument to directly put a feature on a specific layer)
m.add_feature.cultural.admin_0_countries(
layer="overlay", scale=50, fc="none", ec="g", lw=0.3)
# Get a clickable widget to switch between the available plot-layers
m.util.layer_selector(loc="upper center")
# Transparently overlay the "ocean" layer on top of the "data" layer
m.show_layer("data", ("ocean", 0.8))
# ---- Attach callback functions to interact with the map
# (Note: you can also define custom callbacks!)
### CLICK callbacks are executed if you click anywhere on the map
m.cb.click.attach.peek_layer(layer="overlay", how=0.4)
m.cb.click.attach.mark(shape="geod_circles", radius=5e5, button=3, fc="r")
# Use keypress-modifiers to trigger callbacks only if a button is pressed
m.cb.click.attach.annotate(modifier="a")
### PICK callbacks identify the closest datapoint of a dataset
m_data.cb.pick.attach.annotate(text=lambda val, **kwargs: f"value = {val:.2f}")
m_inset.cb.pick.attach.annotate()
### KEYPRESS callbacks are executed if you press a key on the keyboard
# (using "m.all" ensures that the cb triggers irrespective of the visible layer)
m.all.cb.keypress.attach.switch_layer(layer="data", key="1")
m.all.cb.keypress.attach.switch_layer(layer="data|ocean", key="2")
### Reposition axes based on a pre-defined layout (check m.get_layout())
m.apply_layout(
{'figsize': [12.0, 8.0],
'0_map': [0.44306, 0.25, 0.48889, 0.73333],
'1_cb': [0.115, 0.0, 0.775, 0.23377],
'1_cb_histogram_size': 0.8,
'2_inset_map': [0.03335, 0.35, 0.33329, 0.5]}
)
### Plot data directly from GeoTIFF / NetCDF or CSV files
#m4 = m.new_layer_from_file.GeoTIFF(...)
#m4 = m.new_layer_from_file.NetCDF(...)
#m4 = m.new_layer_from_file.CSV(...)- Jakob Quast for designing the nice logo!