code-forensics is a toolset for analysing codebases stored in a version control system. It leverages the repository logs, or version history data, to perform deep analyses with regards to complexity, logical coupling, authors coupling and to inspect the evolution in time of different parts of a software system with respect to metrics like code churn and number of revisions.
This project is based on the excellent work of Adam Tornhill and his command line tool Code Maat. The majority of the analysis that code-forensics performs are actually described in Adam's book Your Code as a Crime Scene.
This release upgrades a number of packages and drops support for old Node versions in order to start migrating the code to ES6.
This release introduces new metrics trends in the system evolution analysis (number of commits, number of authors). This change requires a different logic to generate and render the revisions trend diagram, which breaks compatibility with respect to older versions.
See the CHANGELOG for release details.
- Node.js - From release 1.0.0 code-forensics requires Nodejs 4 or later. If you can't upgrade I suggest you use an earlier version of this package.
- npm v3 - code-forensics requires a flat install of its dependencies into the node_modules folder in order to visualise d3 diagrams.
- code-maat: code-forensics is distributed with a pre-built (a .jar package) version of code-maat that requires Java 8. Alternatively you can use Docker, provided you can supply a docker image of code-maat. See the Code Maat repository for details on how to run the tool with Java or Docker.
$ npm install code-forensics
Note 1: code-forensics is distributed as a nodejs module that runs on top of gulp version 4. Be aware that if you have gulp already installed as a global module and it's not the required version you will have to explicitly execute the gulp command that comes with the installation of code-forensics.
Note 2: I would advise against installing code-forensics as a global module, as it requires certain packages to be at the top level of the node_modules folder in order to correctly run its internal http server and serve the pages to the browser for the visualisation part of the analysis. If code-forensics is installed as a global module such packages may conflict with already existing ones and that could cause all sorts of unpredictable issues.
At the moment code-forensics can work with git and svn based repositories, however other version control systems could be supported in the future, given the ability of Code Maat to parse log data from the most popular ones.
Most of code-forensics analyses are agnostic of the programming language used in the repository, however some tasks can report metrics on the language complexity and currently only Ruby and JavaScript are supported. Complexity analysis for other languages can be added, possibly with your help.
This software is not meant to be a commercial tool, hence support for various operating systems and different browsers is not a priority. I've tested code-forensics on a Mac OS X with different versions of Node.js, and primarily with Chrome as a browser. While I expect (and I'm willing to support) code-forensics to work in linux/unix environments, I can't guarantee it would on a Windows OS.
This is only a short description on how to get started with code-forensics.
PLEASE REFER TO THE WIKI PAGES FOR A MORE COMPREHENSIVE DOCUMENTATION.
Before posting a new issue please make sure you check out the Troubleshooting guide and the Frequently Asked Questions wiki pages.
code-forensics runs as a set of gulp tasks, therefore it requires a gulpfile.js to bootstrap gulp, however there is no need to know the task declaration syntax, as all the necessary tasks are defined inside code-forensics.
The gulpfile.js must define the configuration options and parameters necessary to run code-forensics tasks.
A minimal configuration gulpfile.js would look like the following:
require('code-forensics').configure(
  {
    repository: {
      rootPath: "<path-to-the-repo>",
    }
  }
);
The only required configuration value is the file system path to the root directory of the version control repository to analyse, however this example is not practical and I would recommend you learn about and configure other parameters to more effectively target the analyses you intend to run.
Analyses are executed as a gulp task. Depending on how the gulp module is installed (as global or local) there are different ways to invoke the gulp command. Here, to simplify the examples, I will assume it is available on your command PATH. I will also assume you are running the required version (4) of gulp.
Each analysis may require or accept optional parameters.
$ gulp <analysis-task-name> [parameters]
See below how to learn about any available task parameter.
Note: it is highly recommended to specify a time interval for any analysis. If not, code-forensics will attempt to analyse the git commits for the current date only, most likely resulting in empty or near empty reports. You can specify a time interval via command line parameters or through the configuration file. Please refer to the provided documentation.
By default running gulp without any argument will print the list of all the top level analysis tasks. Alternatively you can explicitly run the task list-analysis-tasks:
$ gulp list-analysis-tasks
Currently the following analyses are implemented:
- javascript-complexity-trend-analysis (when JavaScript is enabled)
- ruby-complexity-trend-analysis (when Ruby is enabled)
- sloc-trend-analysis
- hotspot-analysis
- sum-of-coupling-analysis
- temporal-coupling-analysis
- system-evolution-analysis
- developer-effort-analysis
- developer-coupling-analysis
- knowledge-map-analysis
- commit-message-analysis
There are different options to print all the available tasks.
The help task itself will list all the tasks along with their description, e.g.:
$ gulp help
If you're interested in inspecting the dependencies between tasks you can leverage gulp version 4 way of displaying exeactly that in a nice tree-like format: run gulp -T or gulp --tasks.
In order to learn which parameters can be passed to a task you can type the following command:
$ gulp help --taskName=<task-name>
For most tasks it's possible to specify a time period for which the analysis is performed by passing the parameters dateFrom and dateTo. This is particularly useful to understand the evolution of the code in time and analyse negative or positive trends of particular metrics (see the wiki pages for more detailed documentation).
The results of each analysis can be displayed in the form of D3 diagrams.
Start up the local http server:
$ gulp webserverOpen the browser at http://localhost:3000/index.html to see a list of the available reports.
Say we want to investigate the commit messages in our repository during the first six months of 2016. The commit-message-analysis task produces a report on the most frequently used words in the commit messages:
$ gulp commit-message-analysis --dateFrom=2016-01-01 --dateTo=2016-06-30The output of the command would be something similar to this:
[00:13:07] Starting 'vcs-commit-messages'...
[00:13:07] Fetching git messages from 2010-01-01 to 2010-06-30
[00:13:07] Created: vcs_commit_messages_2010-01-01_2010-06-30.log
[00:13:07] Finished 'vcs-commit-messages' after 214 ms
[00:13:07] Starting 'commit-message-analysis'...
[00:13:07] Generating report file 2010-01-01_2010-06-30_commit-words-data.json
[00:13:07] Open the following link to see the results:
[00:13:07] http://localhost:3000/index.html?reportId=cbd5e3db4ecc7acfb000014f22107ac37e98d785
[00:13:07] Finished 'commit-message-analysis' after 62 ms
The results can then be displayed in a word cloud diagram at the url given above.
| Hotspot | 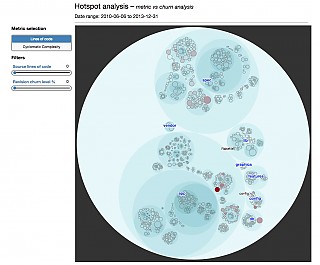 |
Complexity trend | 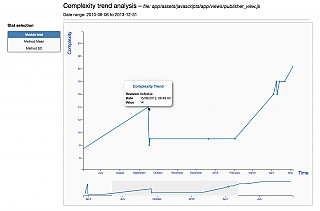 |
| System evolution | 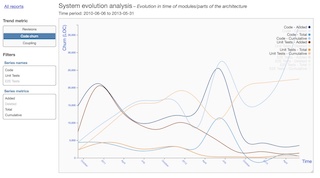 |
Commit messages | 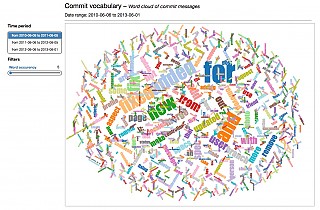 |
| Developer coupling | 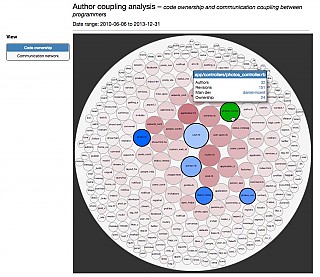 |
Developer network | 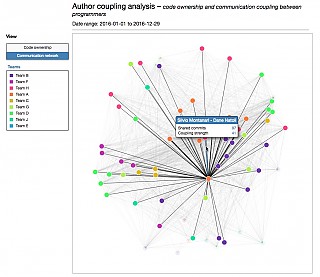 |
| Developer effort | 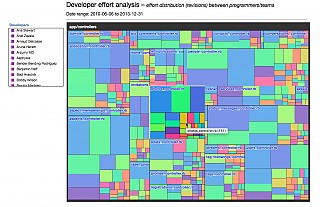 |
Knowledge map | 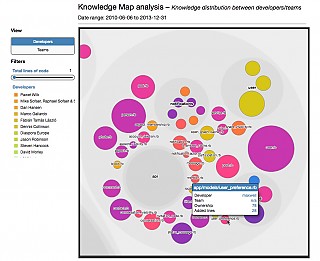 |
In time I'm also planning to add the following analyses in future versions of code-forensics:
- code fragmentation analysis: to be used together with the current developer effort analysis to see if the fragmentation in your files is healthy or not.
- code age analysis: another perspective to find out how old and stable the different parts of your codebase actually are.
Of course, if you think there could be any new analysis or feature that could be useful in this tool, you're welcome to open a new issue and even to help directly with the code!
Copyright © 2016-2021 Silvio Montanari
code-forensics is free software; you can redistribute it and/or modify it under the terms of the GNU General Public License v3.0 or any later version.
code-forensics makes use of Code Maat - Copyright © Adam Tornhill