-
Notifications
You must be signed in to change notification settings - Fork 0
New issue
Have a question about this project? Sign up for a free GitHub account to open an issue and contact its maintainers and the community.
By clicking “Sign up for GitHub”, you agree to our terms of service and privacy statement. We’ll occasionally send you account related emails.
Already on GitHub? Sign in to your account
DSET-4559: Group By fields are part of SessionInfo #62
DSET-4559: Group By fields are part of SessionInfo #62
Conversation
Codecov Report
Additional details and impacted files@@ Coverage Diff @@
## main #62 +/- ##
==========================================
- Coverage 76.12% 75.84% -0.29%
==========================================
Files 12 11 -1
Lines 1713 1763 +50
==========================================
+ Hits 1304 1337 +33
- Misses 340 359 +19
+ Partials 69 67 -2
|
|
For the roll out purposes since in theory the change is "breaking", do you think we need a feature flag (it can also be on by default) so user can turn it off in case something goes wrong? Or you think no feature flag / config option is needed? |
There was a problem hiding this comment.
Choose a reason for hiding this comment
The reason will be displayed to describe this comment to others. Learn more.
Minor comment / question on debug=true test case, besides that, LGTM.
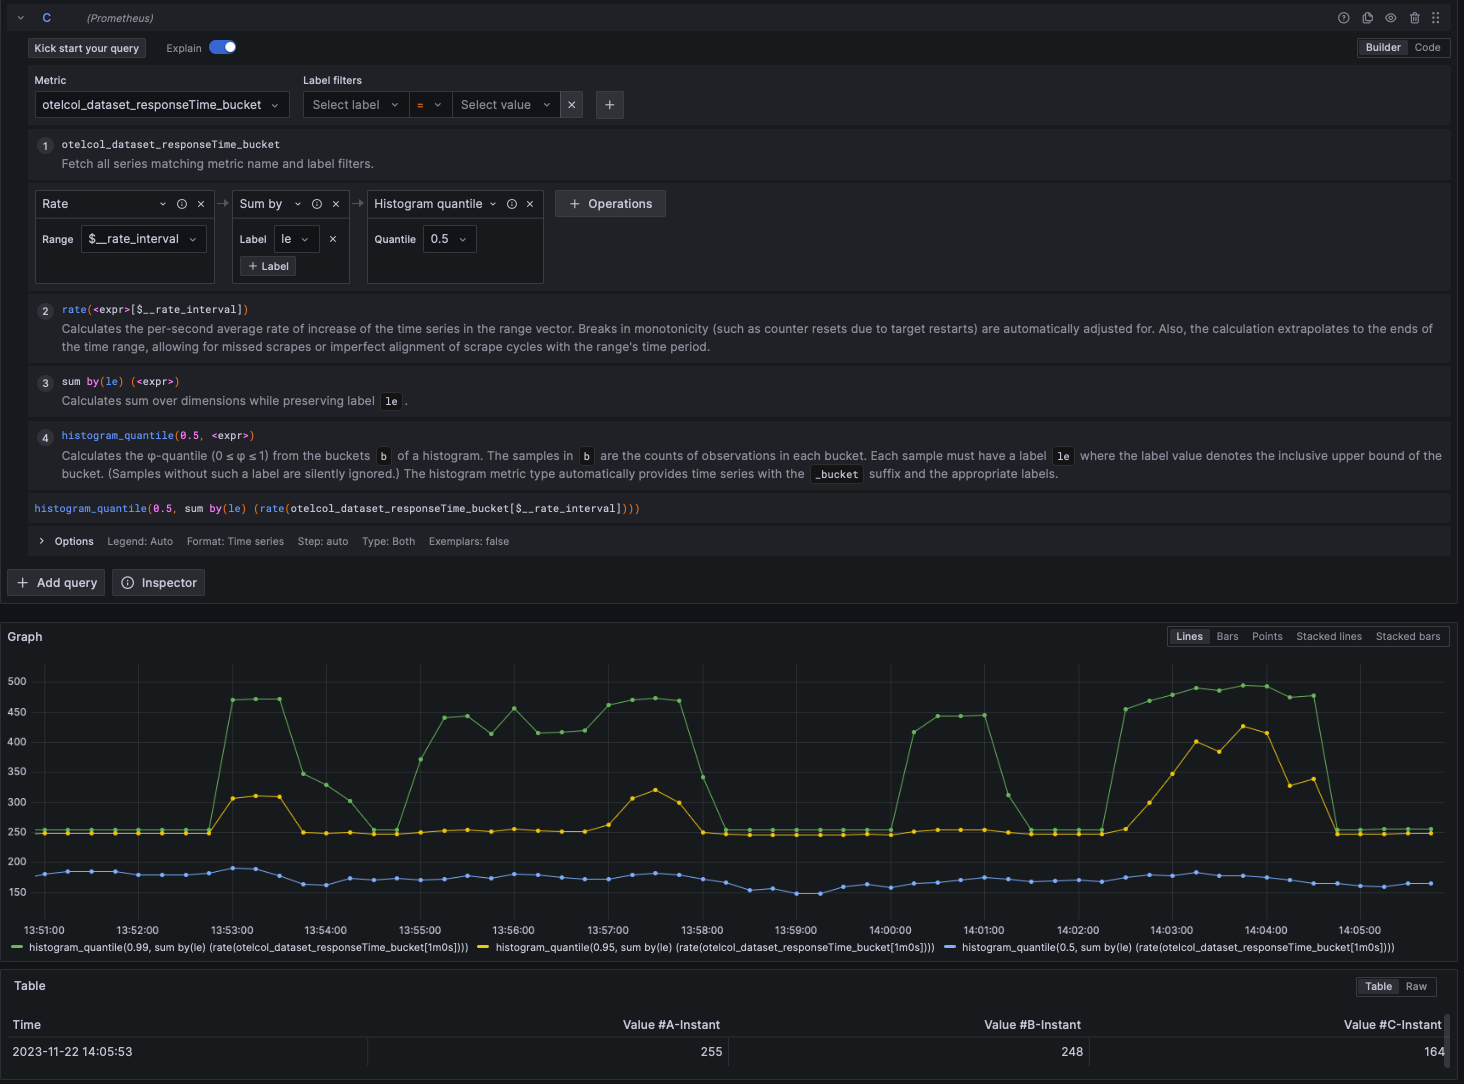
Upgrade to new version of the library. This PR is implementing following issues: * #27650 - metrics are not collected via open telemetry, so they can be monitored. It's better version of the previous PR #27487 which was not working. * #27652 - it's configurable with the `debug` option whether `session_key` is included or not Other change is that fields that are specified as part of the `group_by` configuration are now transferred as part of the session info. **Link to tracking Issue:** #27650, #27652 **Testing:** 1. Build docker image - make docker-otelcontribcol 2. Checkout https://github.com/open-telemetry/opentelemetry-demo 3. Update configuration in `docker-compose.yaml` and in the `src/otelcollector/otelcol-config.yml`: * In `docker-compose.yaml` switch image to the newly build one in step 1 * In `docker-compose.yaml` enable feature gate for collecting metrics - `--feature-gates=telemetry.useOtelForInternalMetrics` * In `src/otelcollector/otelcol-config.yml` enable metrics scraping by prometheus * In `src/otelcollector/otelcol-config.yml` add configuration for dataset ```diff diff --git a/docker-compose.yml b/docker-compose.yml index 001f7c8..d7edd0d 100644 --- a/docker-compose.yml +++ b/docker-compose.yml @@ -646,14 +646,16 @@ services: # OpenTelemetry Collector otelcol: - image: otel/opentelemetry-collector-contrib:0.86.0 + image: otelcontribcol:latest container_name: otel-col deploy: resources: limits: memory: 125M restart: unless-stopped - command: [ "--config=/etc/otelcol-config.yml", "--config=/etc/otelcol-config-extras.yml" ] + command: [ "--config=/etc/otelcol-config.yml", "--config=/etc/otelcol-config-extras.yml", "--feature-gates=telemetry.useOtelForInternalMetrics" ] volumes: - ./src/otelcollector/otelcol-config.yml:/etc/otelcol-config.yml - ./src/otelcollector/otelcol-config-extras.yml:/etc/otelcol-config-extras.yml diff --git a/src/otelcollector/otelcol-config.yml b/src/otelcollector/otelcol-config.yml index f2568ae..9944562 100644 --- a/src/otelcollector/otelcol-config.yml +++ b/src/otelcollector/otelcol-config.yml @@ -15,6 +15,14 @@ receivers: targets: - endpoint: http://frontendproxy:${env:ENVOY_PORT} + prometheus: + config: + scrape_configs: + - job_name: 'otel-collector' + scrape_interval: 5s + static_configs: + - targets: ['0.0.0.0:8888'] + exporters: debug: otlp: @@ -29,6 +37,22 @@ exporters: endpoint: "http://prometheus:9090/api/v1/otlp" tls: insecure: true + logging: + dataset: + api_key: API_KEY + dataset_url: https://SERVER.scalyr.com + debug: true + buffer: + group_by: + - resource_name + - resource_type + logs: + export_resource_info_on_event: true + server_host: + server_host: Martin + use_hostname: false + dataset/aaa: + api_key: API_KEY + dataset_url: https://SERVER.scalyr.com + debug: true + buffer: + group_by: + - resource_name + - resource_type + logs: + export_resource_info_on_event: true + server_host: + server_host: MartinAAA + use_hostname: false processors: batch: @@ -47,6 +71,11 @@ processors: - set(description, "") where name == "queueSize" # FIXME: remove when this issue is resolved: open-telemetry/opentelemetry-python-contrib#1958 - set(description, "") where name == "http.client.duration" + attributes: + actions: + - key: otel.demo + value: 29446 + action: upsert connectors: spanmetrics: @@ -55,13 +84,13 @@ service: pipelines: traces: receivers: [otlp] - processors: [batch] - exporters: [otlp, debug, spanmetrics] + processors: [batch, attributes] + exporters: [otlp, debug, spanmetrics, dataset, dataset/aaa] metrics: - receivers: [httpcheck/frontendproxy, otlp, spanmetrics] + receivers: [httpcheck/frontendproxy, otlp, spanmetrics, prometheus] processors: [filter/ottl, transform, batch] exporters: [otlphttp/prometheus, debug] logs: receivers: [otlp] - processors: [batch] - exporters: [otlp/logs, debug] + processors: [batch, attributes] + exporters: [otlp/logs, debug, dataset, dataset/aaa] ``` 4. Run the demo - `docker compose up --abort-on-container-exit` 5. Check, that metrics are in Grafana - http://localhost:8080/grafana/explore? <img width="838" alt="Screenshot 2023-11-27 at 12 29 29" src="https://github.com/open-telemetry/opentelemetry-collector-contrib/assets/122797378/43d365dd-37d8-4528-b768-1d7f0ac34989"> 6. Check some metrics  <img width="1356" alt="Screenshot 2023-11-27 at 12 59 10" src="https://github.com/open-telemetry/opentelemetry-collector-contrib/assets/122797378/34c36e45-850e-4e74-a18a-0a54ce97cbd3"> 7. Check that data are available in dataset  **Documentation:** **Library changes:** * Group By & Debug - scalyr/dataset-go#62 * Metrics - scalyr/dataset-go#61 --------- Co-authored-by: Andrzej Stencel <astencel@sumologic.com>
Jira Link: https://sentinelone.atlassian.net/browse/DSET-4559
🥅 Goal
Existing integrations are supporting the specification of the server fields. It was not possible using this library. This PR allows to put arbitrary attributes into
SessionInfo.🛠️ Solution
DataSet UI is showing "Attributes" and "Server Fields". Server fields are taken from the
sessionInfoparameter in the AddEvents API call. This behaviour is not documented there.This PR is changing:
logfileas another attribute, that is used for grouping. Now there isserverHostandlogfile.Event.attrstosessionInfobundle_keyamong attributes.🏫 Testing
To be able to test it:
opentelemetry-collector-contribto use the modified library and do not use cached layers:make docker-otelcontribcolto build docker imagesopentelemetry-demoto use built image instead of the official one:src/otelcollector/otelcol-config.ymlto include datasetexporter configuration.docker compose up --abort-on-container-exit