daru-view is for easy and interactive plotting in web application & IRuby notebook. daru-view is a plugin gem to the existing daru gem


Daru (Data Analysis in Ruby) is a library for analysis, manipulation, and visualization of data. Daru-view is for easy and interactive plotting in web applications & IRuby notebook. It can work in frameworks like Rails, Sinatra, Nanoc, and hopefully in others too.
It is a plugin gem to Data Analysis in Ruby(Daru) for visualization of data
Add this line to your application's Gemfile:
gem 'daru-view', git: 'https://github.com/SciRuby/daru-view'And then execute:
$ bundle
Or install it yourself as:
$ gem install daru-view
If the above is not working or you want to install the latest version from the GitHub repo:
gem install specific_install
gem specific_install https://github.com/SciRuby/daru-view
-
To install IRuby notebook in your system, follow the steps given in IRuby repo.
-
Create a separate folder and Gemfile inside it. Add a minimum these lines to it
source "http://rubygems.org"

# iruby dependencies
gem 'rbczmq'
gem 'ffi-rzmq'
gem 'iruby'

# fetch from the github master branch
gem 'daru-view', :git => 'https://github.com/SciRuby/daru-view'

gem "daru", git: 'https://github.com/SciRuby/daru.git'
gem "nyaplot", git: 'https://github.com/SciRuby/nyaplot.git'
gem 'google_visualr', git: 'https://github.com/winston/google_visualr.git'
gem 'daru-data_tables', git: 'https://github.com/Shekharrajak/daru-data_tables.git'-
Now do
bundle installand runiruby notebook -
You may like to try some examples that are added in specs : spec/dummy_iruby/
# set the library, to plot charts
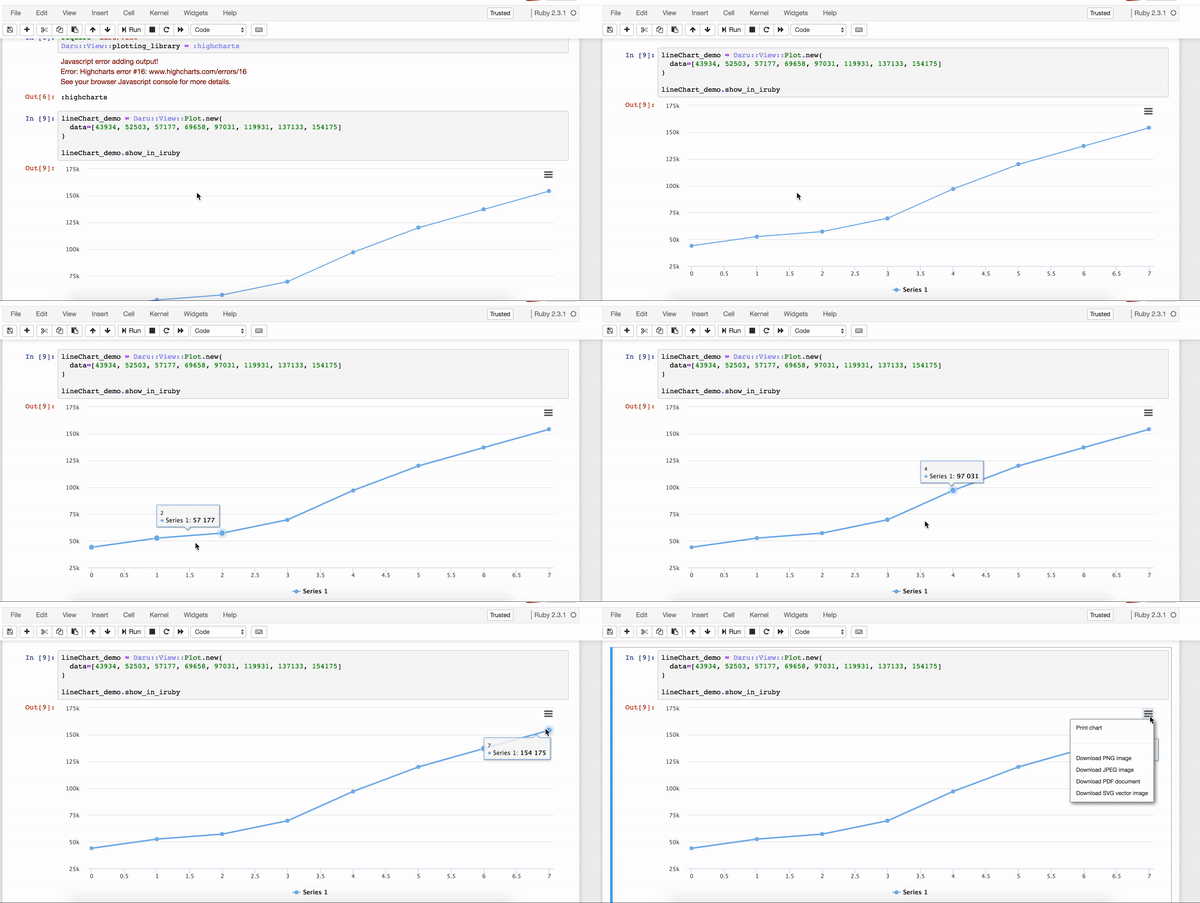
Daru::View.plotting_library = :highcharts

# Simple line chart
@line_graph = Daru::View::Plot.new(
  data=[43934, 52503, 57177, 69658, 97031, 119931, 137133, 154175]
)

# to see graph in IRuby notebook
@line_graph.show_in_iruby

# to see graph in any ruby web application framework
# Add this line in your view file, where you want to see your graph in the web application. (It will put the HTML code of the line graph on the web page)
<%=raw @line_graph.div %># Default chart type is Line.
data = [
[0, 0], [1, 10], [2, 23], [3, 17], [4, 18], [5, 9],
[6, 11], [7, 27], [8, 33], [9, 40], [10, 32], [11, 35],
[12, 30], [13, 40], [14, 42], [15, 47], [16, 44], [17, 48],
[18, 52], [19, 54], [20, 42], [21, 55], [22, 56], [23, 57],
[24, 60], [25, 50], [26, 52], [27, 51], [28, 49], [29, 53],
[30, 55], [31, 60], [32, 61], [33, 59], [34, 62], [35, 65],
[36, 62], [37, 58], [38, 55], [39, 61], [40, 64], [41, 65],
[42, 63], [43, 66], [44, 67], [45, 69], [46, 69], [47, 70],
[48, 72], [49, 68], [50, 66], [51, 65], [52, 67], [53, 70],
[54, 71], [55, 72], [56, 73], [57, 75], [58, 70], [59, 68],
[60, 64], [61, 60], [62, 65], [63, 67], [64, 68], [65, 69],
[66, 70], [67, 72], [68, 75], [69, 80]
]
line_basic_chart = Daru::View::Plot.new(data)
line_basic_chart.show_in_irubycountry_population = [
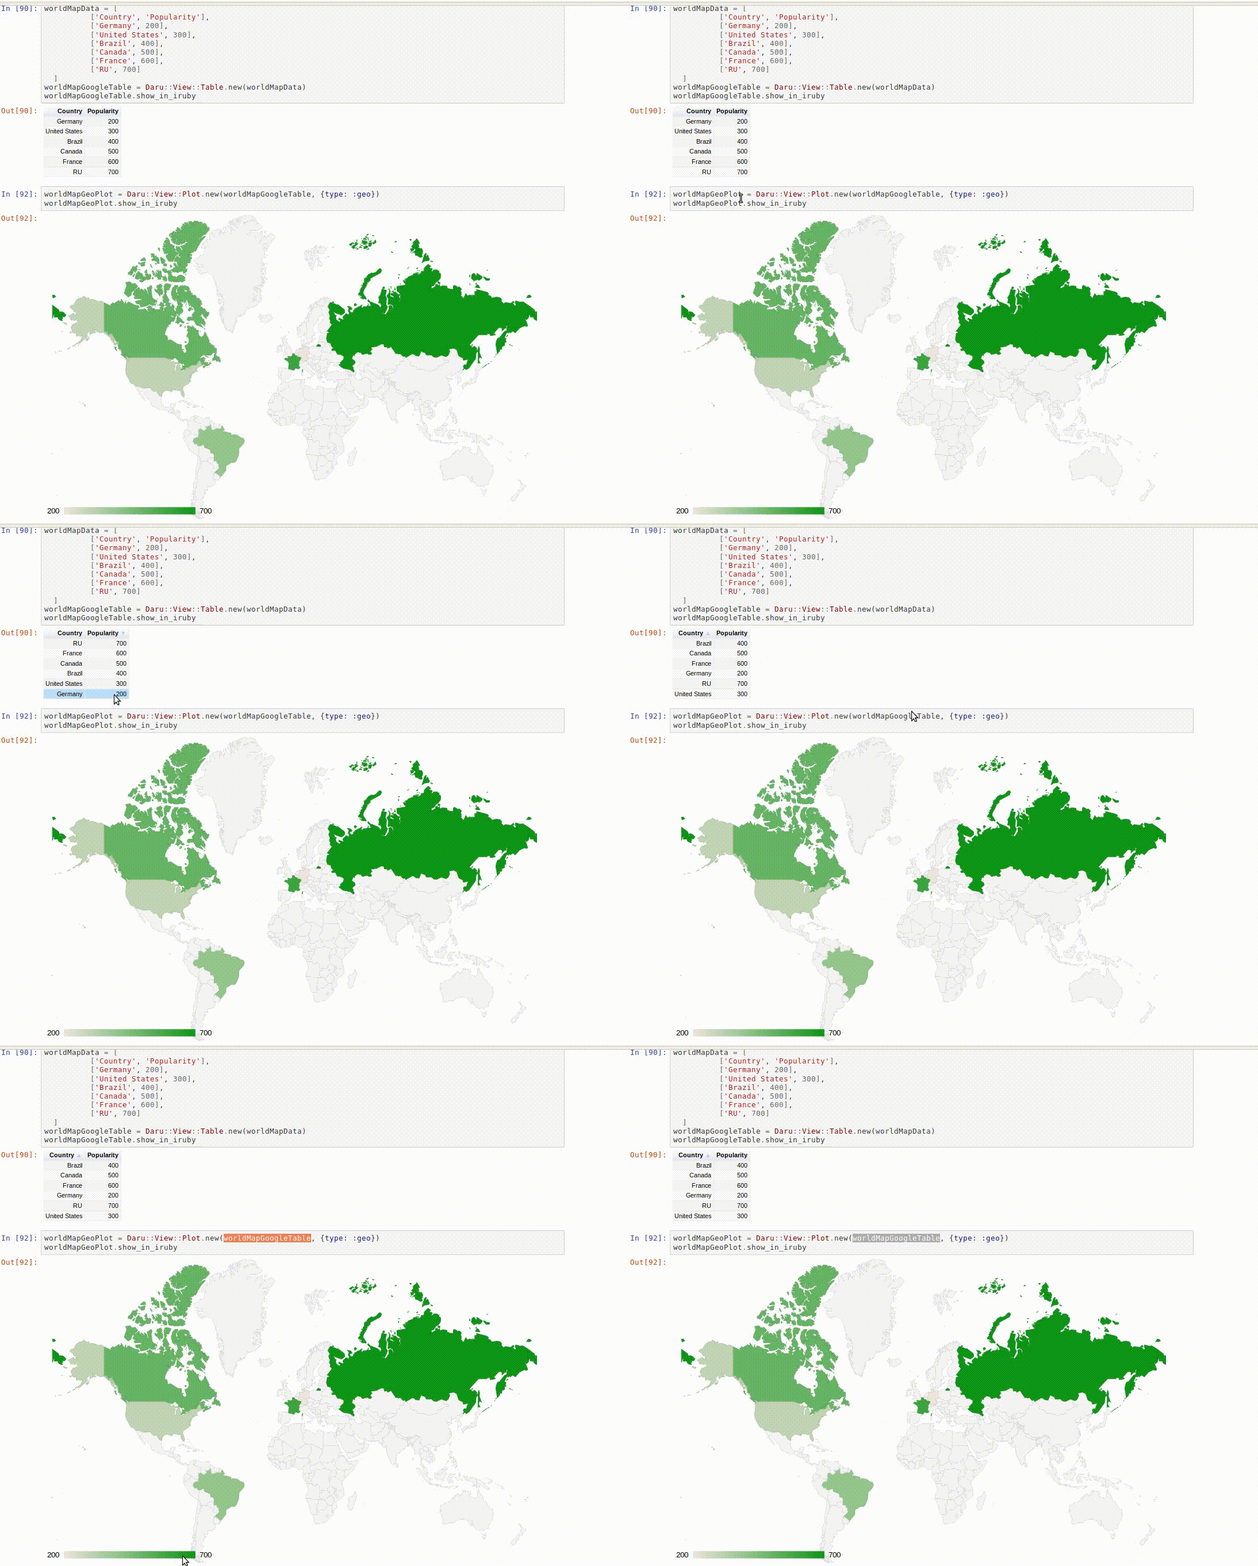
['Germany', 200],
['United States', 300],
['Brazil', 400],
['Canada', 500],
['France', 600],
['RU', 700]
]
df_cp = Daru::DataFrame.rows(country_population)
df_cp.vectors = Daru::Index.new(['Country', 'Population'])
geo_table = Daru::View::Table.new(df_cp, pageSize: 5, adapter: :googlecharts, height: 200, width: 200)
geochart = Daru::View::Plot.new(
geo_table.table, type: :geo, adapter: :googlecharts, height: 500, width: 800)
geochart.show_in_iruby- You can find more examples in this IRuby notebook example.
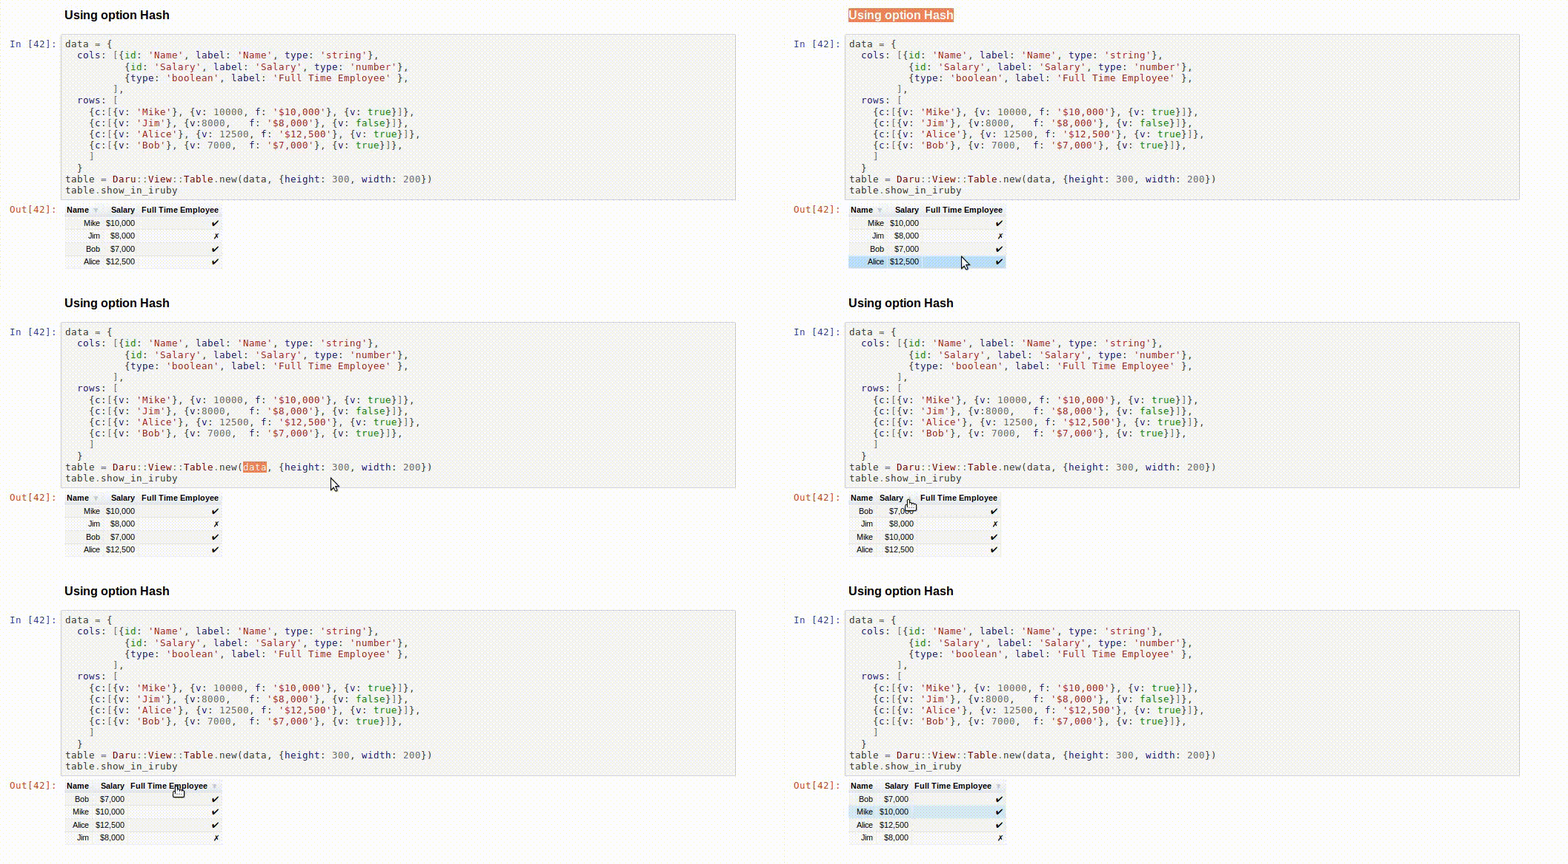
data = {
  cols: [{id: 'Name', label: 'Name', type: 'string'},
          {id: 'Salary', label: 'Salary', type: 'number'},
          {type: 'boolean', label: 'Full Time Employee' },
        ],
  rows: [
    {c:[{v: 'Mike'}, {v: 10000, f: '$10,000'}, {v: true}]},
    {c:[{v: 'Jim'}, {v:8000,   f: '$8,000'}, {v: false}]},
    {c:[{v: 'Alice'}, {v: 12500, f: '$12,500'}, {v: true}]},
    {c:[{v: 'Bob'}, {v: 7000,  f: '$7,000'}, {v: true}]},
    ]
  }
table = Daru::View::Table.new(data, {height: 300, width: 200})
table.show_in_iruby- Check out more amazing examples of GoogleChart datatable in IRuby notebook.
arrayOfArray = [
      [1, 3, 5, 7, 5, 0],
      [1, 5, 2, 5, 1, 0],
      [1, 6, 7, 2, 6, 0]
    ]
arrayOfArrayTable = Daru::View::Table.new(arrayOfArray, pageLength: 3, adapter: :datatables)

# paste the div part of the table in view part of the app or any HTML file.
# First load the dependency for the datatable using this line : `Daru::View.dependent_script(:datatables)`
arrayOfArrayTable.div

# For Rails application, we can use this line  <%=raw arrayOfArrayTable.div %>
# For Nanoc and Sinatra application, we can use this line <%= arrayOfArrayTable.div %>-
NOTE: It works seamlessly in Ruby web applications, but currently DataTable doesn't work in IRuby notebook, because of conflict in DataTable dependent js and IRuby dependent js.
-
To see more examples, please check datatables examples written in demo_daru-view repository for different Ruby web application frameworks.
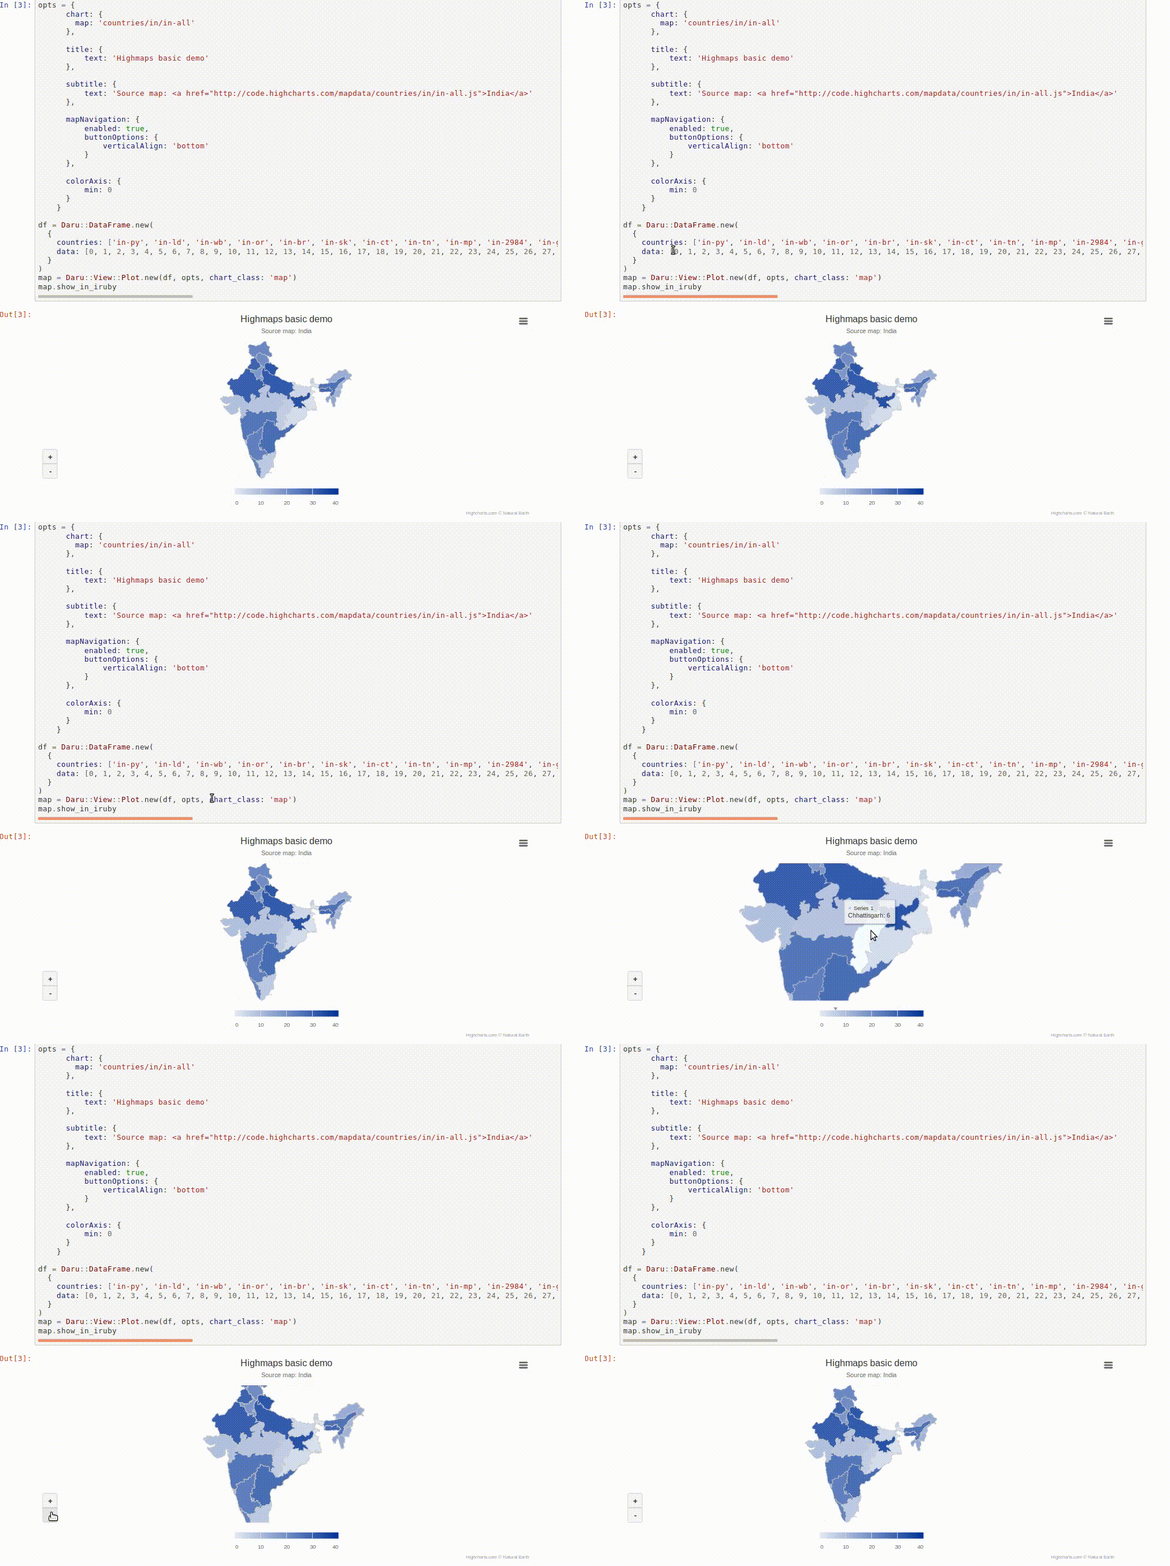
opts = {
      chart: {
        map: 'countries/in/in-all'
      },

      title: {
          text: 'Highmaps basic demo'
      },

      subtitle: {
          text: 'Source map: <a href="http://code.highcharts.com/mapdata/countries/in/in-all.js">India</a>'
      },

      mapNavigation: {
          enabled: true,
          buttonOptions: {
              verticalAlign: 'bottom'
          }
      },

      colorAxis: {
          min: 0
      }
    }

df = Daru::DataFrame.new(
  {
    countries: ['in-py', 'in-ld', 'in-wb', 'in-or', 'in-br', 'in-sk', 'in-ct', 'in-tn', 'in-mp', 'in-2984', 'in-ga', 'in-nl', 'in-mn', 'in-ar', 'in-mz', 'in-tr', 'in-3464', 'in-dl', 'in-hr', 'in-ch', 'in-hp', 'in-jk', 'in-kl', 'in-ka', 'in-dn', 'in-mh', 'in-as', 'in-ap', 'in-ml', 'in-pb', 'in-rj', 'in-up', 'in-ut', 'in-jh'],
    data: [0, 1, 2, 3, 4, 5, 6, 7, 8, 9, 10, 11, 12, 13, 14, 15, 16, 17, 18, 19, 20, 21, 22, 23, 24, 25, 26, 27, 28, 29, 30, 31, 32, 33]
  }
)
map = Daru::View::Plot.new(df, opts, chart_class: 'map')
map.show_in_iruby- Read more about HighMap API in daru-view gem in this wiki page section.
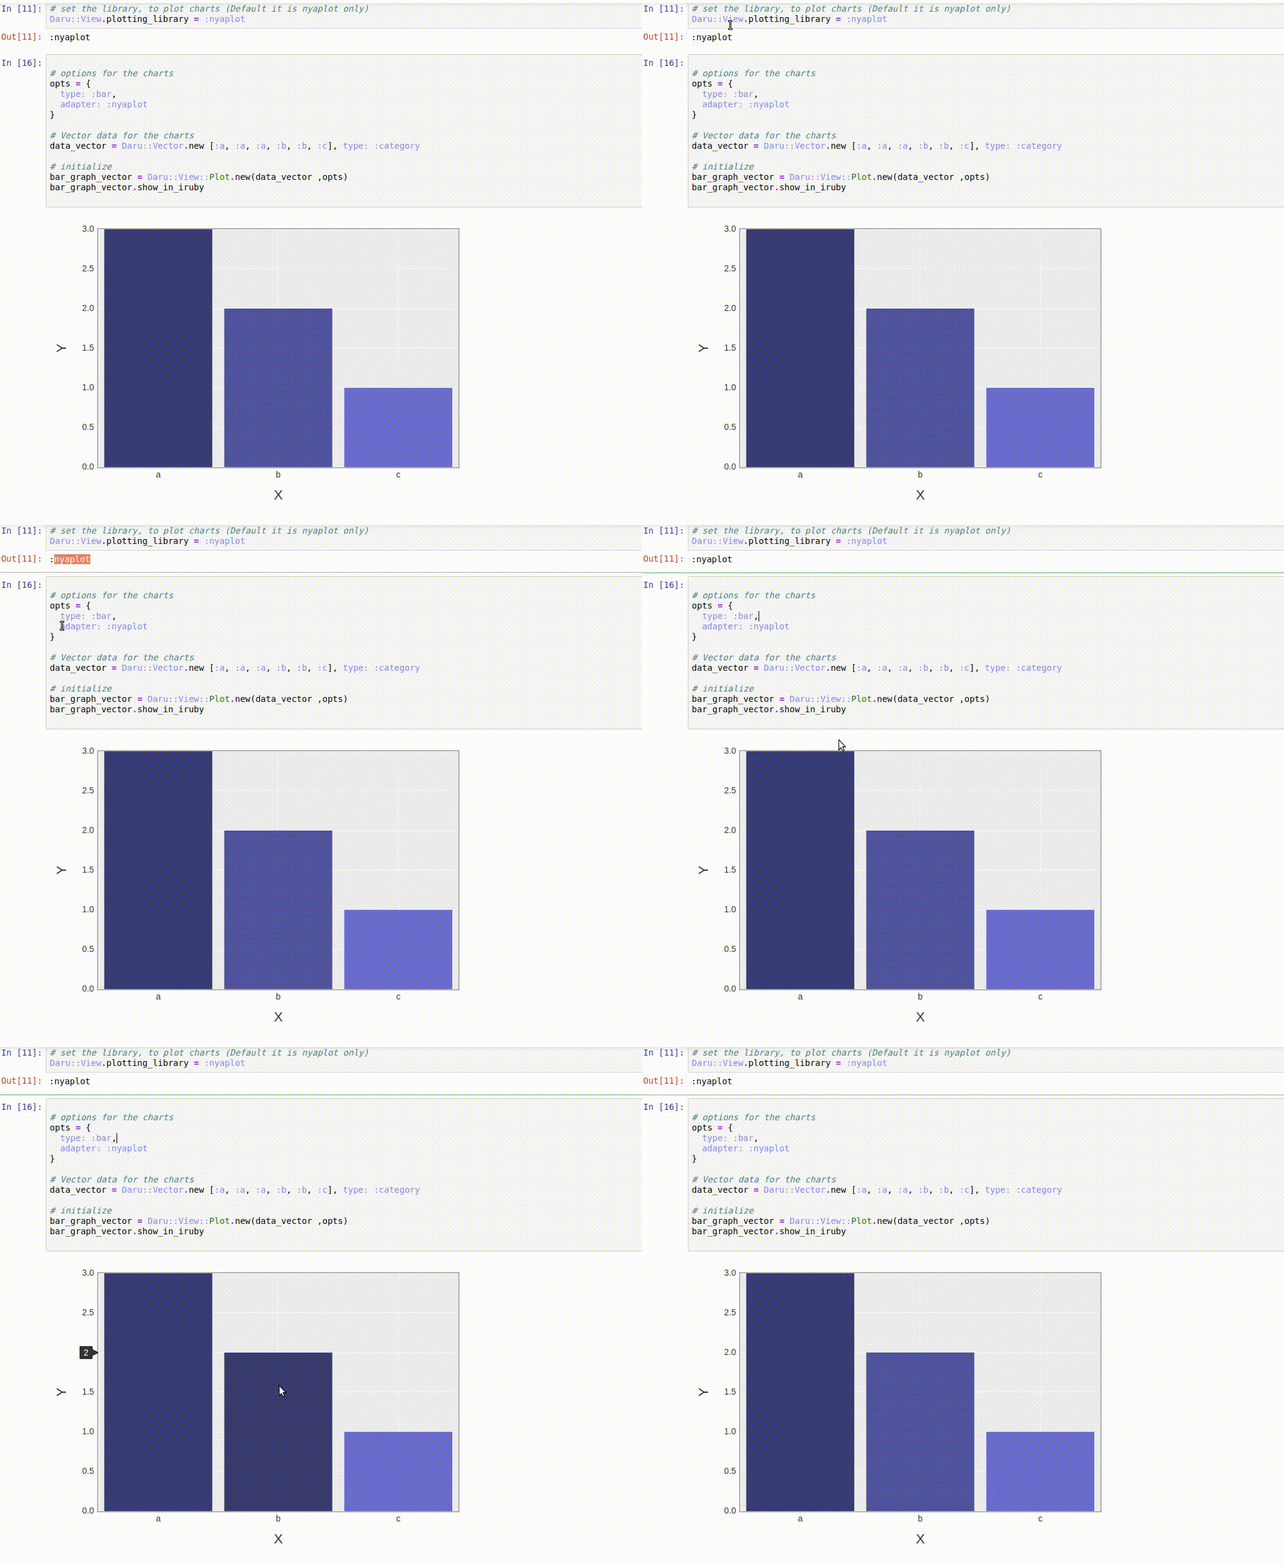
# set the library, to plot charts (Default it is nyaplot only)
Daru::View.plotting_library = :nyaplot


# options for the charts
opts = {
  type: :bar
}

# Vector data for the charts
data_vector = Daru::Vector.new [:a, :a, :a, :b, :b, :c], type: :category
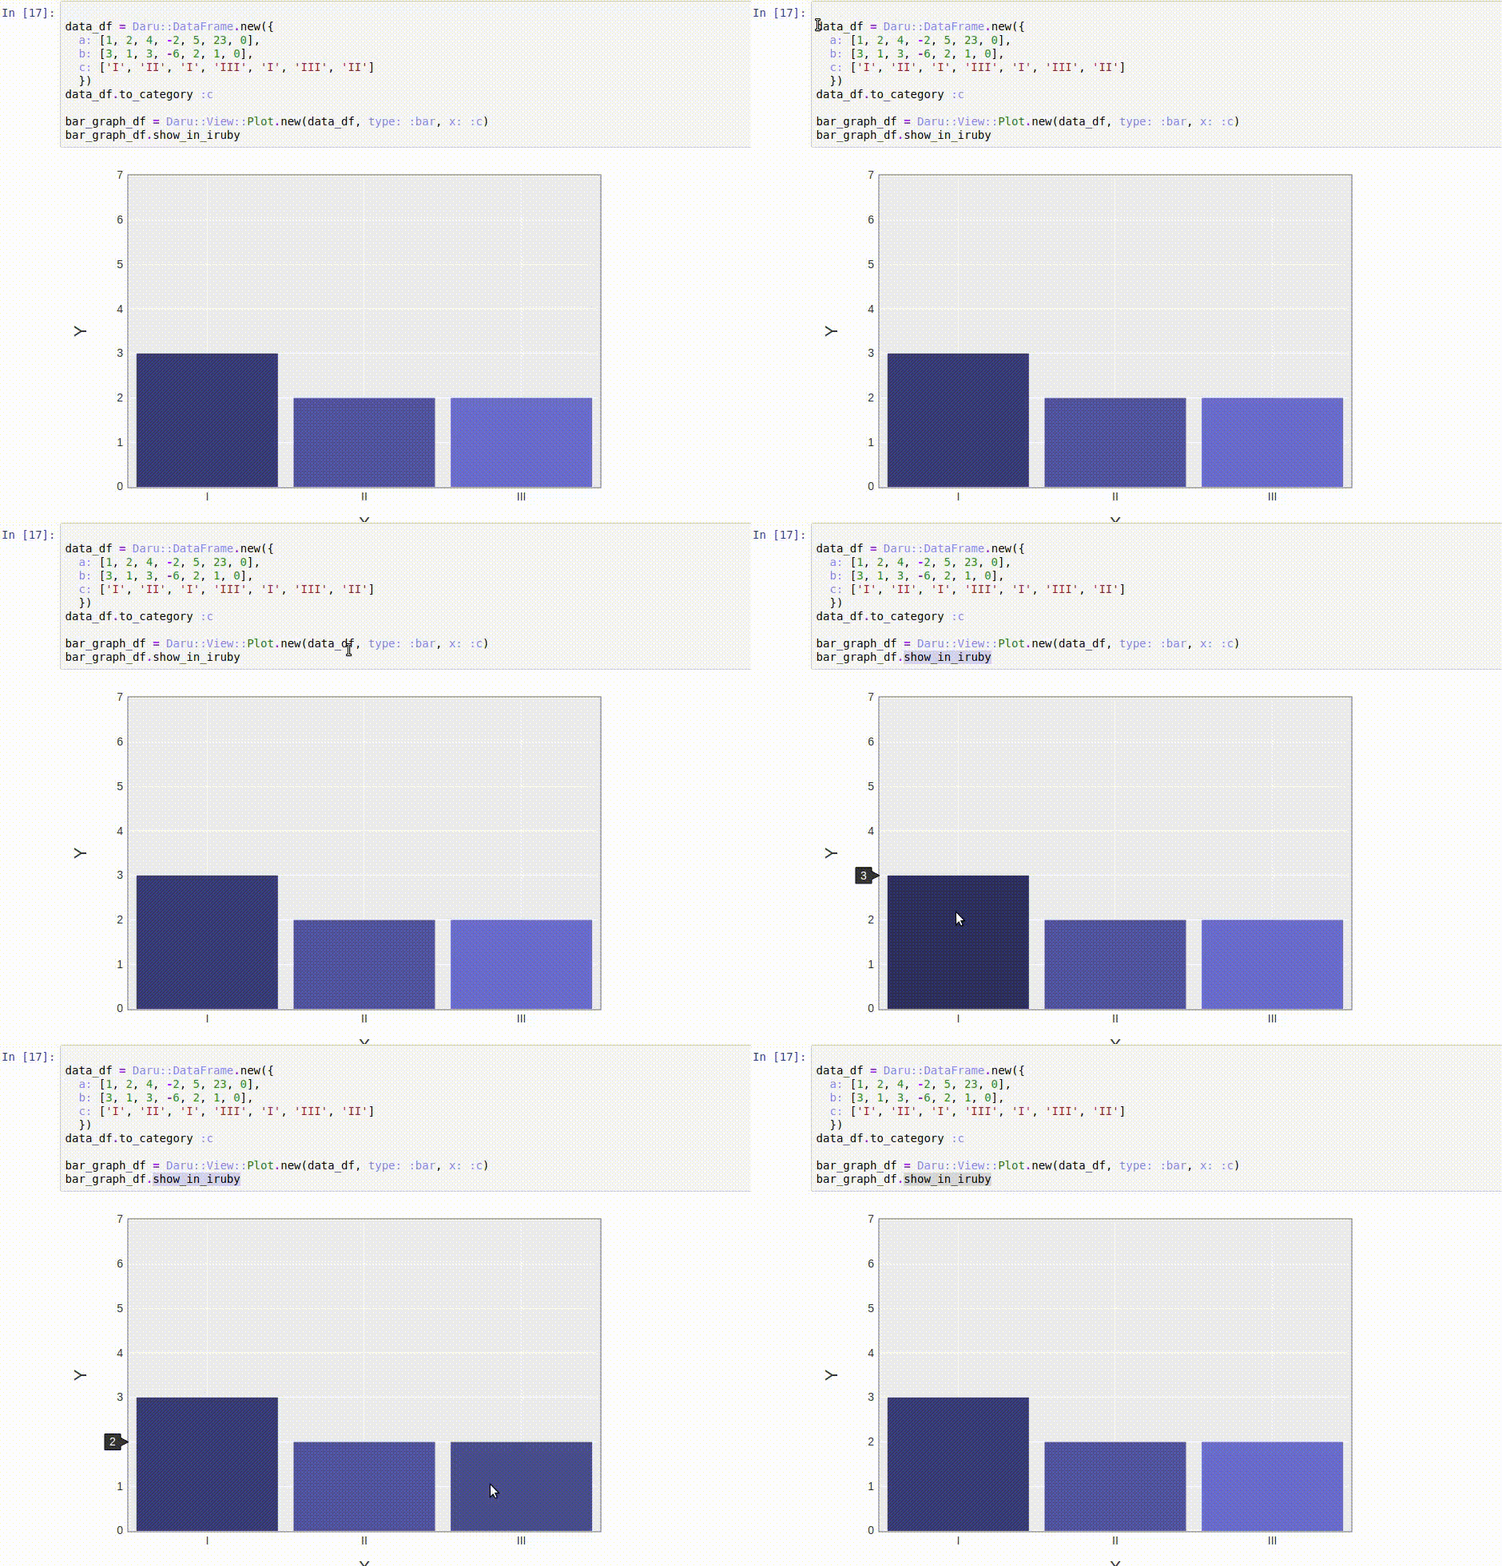
data_df = Daru::DataFrame.new({
  a: [1, 2, 4, -2, 5, 23, 0],
  b: [3, 1, 3, -6, 2, 1, 0],
  c: ['I', 'II', 'I', 'III', 'I', 'III', 'II']
  })
data_df.to_category :c

# initialize
@bar_graph_vector = Daru::View::Plot.new(data_vector ,opts)
@bar_graph_df = Daru::View::Plot.new(data_df, type: :bar, x: :c)

# Add this line in your view file, where you want to see your graph in the web application. (It will put the HTML code of the line graph on the web page)

<%=raw @bar_graph_vector.div %>
<%=raw @bar_graph_df.div %>

# Now refresh the page, you will be able to see your graph.


# IRuby notebook
@bar_graph_vector.show_in_iruby
@bar_graph_df.show_in_iruby
- User can try examples, that are added in Demo web applications (Rails, Sinatra, Nanoc). To set up the rails app, run the following commands :
bundle install
bundle exec rails s
Now go to the http://localhost:3000/nyaplot to see the Nyaplot examples or http://localhost:3000/highcharts and similarly for googlecharts, datatables to see the Highcharts examples.
- Add this line in your Gemfile :
gem 'daru-view', :git => 'https://github.com/sciruby/daru-view.git'

gem "daru", git: 'https://github.com/SciRuby/daru.git'
gem "nyaplot", git: 'https://github.com/SciRuby/nyaplot.git'
gem 'google_visualr', git: 'https://github.com/winston/google_visualr.git'
gem 'daru-data_tables', git: 'https://github.com/Shekharrajak/daru-data_tables.git'
Note : Right now, in daru-view gemspec file daru and nyaplot are not added as development_dependency. Since daru-view required the latest GitHub version of the Daru and Nyaplot gem and we can't fetch gem from GitHub in the gemspec.
-
In the controller, do the data analysis process using daru operations and get the DataFrame/Vectors.
-
Set a plotting library using e.g.
Daru::View.plotting_library = :highcharts -
To set up the dependencies of HighCharts/DataTables in rails app, we can use the below line in app/assets/javascript/application.js file :
//= require highcharts/highcharts
//= require highcharts/highcharts-more
//= require highcharts/map
//= require jquery-latest.min
//= require jquery.dataTables
and CSS files can be included as:
*= require jquery.dataTables
Include the below line in the head of the layout file(wherever you want to plot charts):
<%= javascript_include_tag "application" %>
<%= stylesheet_link_tag "application" %>
NOTE: [ Old way ] In view, add the required JS files (for the plotting library), in head tag (generally) using the line, e.g.: Daru::View.dependent_script(:highcharts)
The line <%=raw Daru::View.dependent_script(:highcharts) %> for rails app, must be added in the layout file of the application.
You can read more about this feature in this wiki page section.
- In view, add the required JS files (for the plotting library), in head tag (generally) using the line , e.g. :
Daru::View.dependent_script(:highcharts)
The line <%= Daru::View.dependent_script(:highcharts) %> for sinatra app, must be added in the layout file of the application(inside the head tag).
# In side the `app.rb` user must do data analysis process using daru features and define the Daru::View::Plot class instance variables to pass into the webpages in the `view` files. You will understand this better if you will try to run sinatra app present in the `[Demo web applications (Rails, Sinatra, Nanoc)](https://github.com/Shekharrajak/demo_daru-view)`

# Add this line in your view file, where you want to see your graph in the web application. (It will put the HTML code of the line graph on the web page)

<%= @line_graph.div %>

<%= @bar_graph1.div %>
<%= @bar_graph2.div %>

# Now refresh the page, you will be able to see your graph.- User can try examples, that are added in Demo web applications (Rails, Sinatra, Nanoc). To set up the rails app, run the following commands :
bundle install
bundle exec ruby app.rb
Now go to the http://localhost:4567/nyaplot to see the Nyaplot examples or http://localhost:4567/highcharts to see the Highcharts examples.
Most of the things are similar to the Rails application (syntax of the view part of the application).
- User can try examples, that are added in Demo web applications (Rails, Sinatra, Nanoc). To set up the rails app, run the following commands :
bundle install
bundle exec nanoc
bundle exec nanoc view
Now go to the http://localhost:3000/nyaplot to see the Nyaplot examples or http://localhost:3000/highcharts and similarly for googlecharts, datatables to see the Highcharts examples.
Nanoc web application compiles and generates the HTML code of the nanoc web application. So you can see the running Nanoc app here :
Note: There is some problem in nyaplot (in the live link. It works fine locally). Some CSS is not working so some styling ain't working properly. You can see it properly in the local setup.
For now, for other applications (Rails/Sinatra) you need to run it locally.
- To view command usage:
daru-view
- To update all the JS files:
daru-view update
- To update JS files for google charts:
daru-view update -g (or) --googlecharts
- To update JS files for highcharts:
daru-view update -H (or) --highcharts
To update to the current highcharts.js directly from http://code.highcharts.com/", you can always run
rake highcharts:update
And it will be copied to your adapters/js/highcharts_js directory.
Similarly for other libraries.
To update the all libraries Javascript file, run this command :
rake update_all
To create a new adapter Demo, run
rake new:adapter Demo
and a file demo.rb will be created in the daru/view/adapters folder with all the necessary methods (init, init_script, init_ruby, generate_body, show_in_iruby, and export_html_file) as TODO.
After checking out the repo, run bin/setup to install dependencies. You can also run bin/console for an interactive prompt that will allow you to experiment.
Generally, I prefer to use bundle console for testing a few codes and experimenting with the gem repo.
Bug reports and pull requests are welcome on GitHub at https://github.com/sciruby/daru-view. This project is intended to be a safe, welcoming space for collaboration, and contributors are expected to adhere to the Contributor Covenant code of conduct.
Pick a feature from the Roadmap or the issue tracker or think of your own and send me a Pull Request!
For details see CONTRIBUTING.
This software has been developed by Shekhar Prasad Rajak as a product in Google Summer of Code 2017 (GSoC2017). Visit the blog posts or mailing list of SciRuby to see the progress of this project.
The gem is available as open-source under the terms of the MIT License.
Copyright (c) 2017 Shekhar Prasad Rajak(@shekharrajak)
