Run the following from an R console:
if(!require("devtools"))  install.packages("devtools")
devtools::install_github("XiaodanLyu/viscover")This tiny package is developed to web-scrape USDA-NASS cropland data
layer (CDL) and USDA-NRCS soil data
layer
(SDL) at point-level and small domain. This package also embeds a Shiny(Chang et al. 2018) application I developed to visualize the
two data layers. You can run this tool from R console using runTool() or interact with this tool lively at https://lyux.shinyapps.io/viscover/.
This Shiny tool is now featured in the RStudio Shiny Gallery. If you are interested in learning more about my experience or seeking for general advice about R Shiny development, please refer to this blog post I wrote on my personal website.
The following screenshot of the tool shows our lovely Iowa State University campus (center grey area) is surrounded by large fields of soybeans (green pixels) and corns (yellow pixels).

library(viscover)
GetCDLValue(year = 2018, lon = -93.65, lat = 42.03)
#> $value
#> [1] "124"
#>
#> $category
#> [1] "Developed/High Intensity"
#>
#> $color
#> [1] "#9C9C9C"
GetSDLValue(lon = -93.65, lat = 42.03)
#> Loading required namespace: rgeos
#> single result set, returning a data.frame
#>   areasymbol musym   mukey                               muname muacres
#> 1 IA169 L55 2800480 Nicollet loam, 1 to 3 percent slopes 45662poly is an example soil spatial polygon data frame embedded in this
package.
setwd("C:/Users/lyux/")
sp::bbox(poly)
#>         min       max
#> x -93.67166 -93.65910
#> y  42.05230  42.07128
GetCDLFile(year = 2018, b = poly)
#> class       : RasterLayer
#> dimensions  : 72, 37, 2664  (nrow, ncol, ncell)
#> resolution  : 30, 30  (x, y)
#> extent      : 191325, 192435, 2119095, 2121255  (xmin, xmax, ymin, ymax)
#> coord. ref. : +proj=aea +lat_1=29.5 +lat_2=45.5 +lat_0=23 +lon_0=-96 +x_0=0 +y_0=0 +ellps=GRS80 +towgs84=0,0,0,0,0,0,0 +units=m +no_defs
#> data source : C:\Users\lyux\Temp\tmp.tif
#> names       : tmp
#> values      : 0, 255  (min, max)
R package soilDB(Skovlin and Roecker 2019) provides a convenient
function for fetching soil data by bounding box.
soilDB::mapunit_geom_by_ll_bbox(sp::bbox(poly))
#> OGR data source with driver: GML
#> Source: "C:\Users\lyux\AppData\Local\Temp\RtmpCQXrw9\file1f046be166a9.gml", layer: "mapunitpoly"
#> with 89 features
#> It has 8 fields
#> class       : SpatialPolygonsDataFrame
#> features    : 89
#> extent      : -93.69867, -93.505, 41.86315, 42.20929  (xmin, xmax, ymin, ymax)
#> coord. ref. : NA
#> variables   : 7
#> names       : areasymbol, spatialversion, musym, nationalmusym,   mukey, muareaacres, mupolygonkey
#> min values  :      IA169,              9,   108,         2s088, 2765537,  0.66275951,    210801004
#> max values : IA169, 9, W, ft19, 411348, 9.50876739, 210839804TileinPoly gives a tabular result of the tile points overlaid with the
spatial polygon.
library(tidyverse)
cdl_tmp <- raster::raster(system.file("tif/cdl_tmp.tif", package = "viscover"))
scover <- TileinPoly(tile = cdl_tmp, poly = poly)
glimpse(scover)
#> Observations: 9
#> Variables: 2
#> $ . <fct> 1, 5, 27, 36, 121, 141, 176, 190, 195
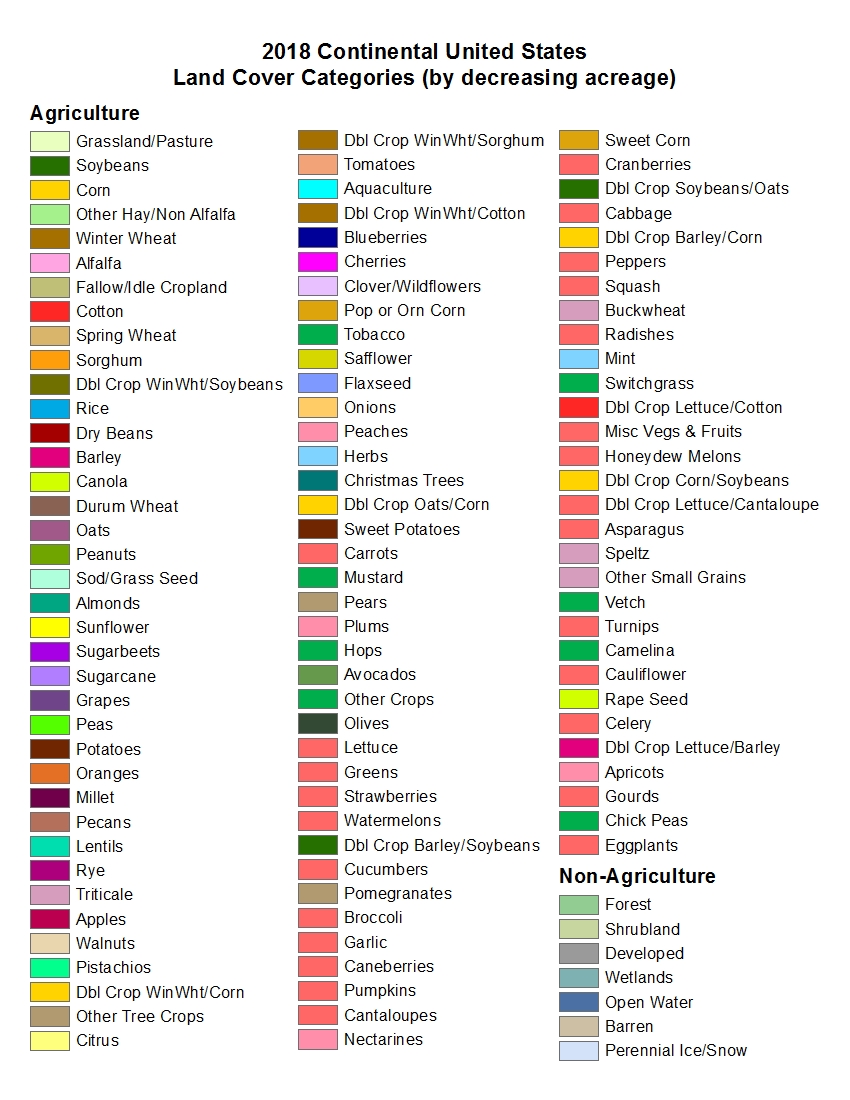
#> $ Freq <int> 255, 5, 1, 7, 18, 161, 69, 27, 18One can refer cdl.dbf to interpret the CDL code. cdl.dbf also
contains the RGB color code used by CDL legend
(https://www.nass.usda.gov/Research_and_Science/Cropland/docs/US_2018_CDL_legend.jpg).
cdl.dbf %>% glimpse()
#> Observations: 255
#> Variables: 6
#> $ VALUE      <int> 0, 1, 2, 3, 4, 5, 6, 7, 8, 9, 10, 11, 12, 13, 14, 1...
#> $ CLASS_NAME <fct> Background, Corn, Cotton, Rice, Sorghum, Soybeans, ...
#> $ RED        <dbl> 0.0000000, 1.0000000, 1.0000000, 0.0000000, 1.00000...
#> $ GREEN      <dbl> 0.0000000, 0.8274510, 0.1490196, 0.6588235, 0.61960...
#> $ BLUE       <dbl> 0.00000000, 0.00000000, 0.14901961, 0.89803922, 0.0...
#> $ OPACITY    <dbl> 0, 1, 1, 1, 1, 1, 1, 1, 1, 1, 1, 1, 1, 1, 1, 1, 1, ...
scover %>%
  mutate_if(is.factor, funs(as.integer(as.character(.)))) %>%
  left_join(cdl.dbf %>% select(VALUE, CLASS_NAME), by = c("." = "VALUE")) %>%
  glimpse()
#> Observations: 9
#> Variables: 3
#> $ .          <int> 1, 5, 27, 36, 121, 141, 176, 190, 195
#> $ Freq       <int> 255, 5, 1, 7, 18, 161, 69, 27, 18
#> $ CLASS_NAME <fct> Corn, Soybeans, Rye, Alfalfa, Developed/Open Space,...
One can also produce a plot of the overlaid result using
ggplot2(Wickham 2016). cdlpal returns a Hex color code when a CDL category
code is provided.
library(sp)
library(raster)
cdl_pt <- cdl_tmp %>% rasterToPoints(spatial = TRUE)
sdl_poly <- poly %>% spTransform(cdl_pt@proj4string)
cdl_pt[geometry(sdl_poly),] %>% data.frame() %>%
  ggplot() +
  geom_tile(aes(x = x, y = y, fill = cdlpal(cdl_tmp))) +
  scale_fill_identity() + coord_equal() +
  geom_path(aes(x = long, y = lat, group = group), data = fortify(sdl_poly))
Chang, Winston, Joe Cheng, JJ Allaire, Yihui Xie, and Jonathan McPherson. 2018. Shiny: Web Application Framework for R. https://CRAN.R-project.org/package=shiny.
Skovlin, Jay, and Stephen Roecker. 2019. SoilDB: Soil Database Interface. https://CRAN.R-project.org/package=soilDB.
Wickham, Hadley. 2016. Ggplot2: Elegant Graphics for Data Analysis. Springer-Verlag New York. http://ggplot2.org.