This repository contains the Sensu performance testing assets used to stress test and measure Sensu's capabilities. Performance testing is done for every Sensu major and minor release to help guard against performance regressions.
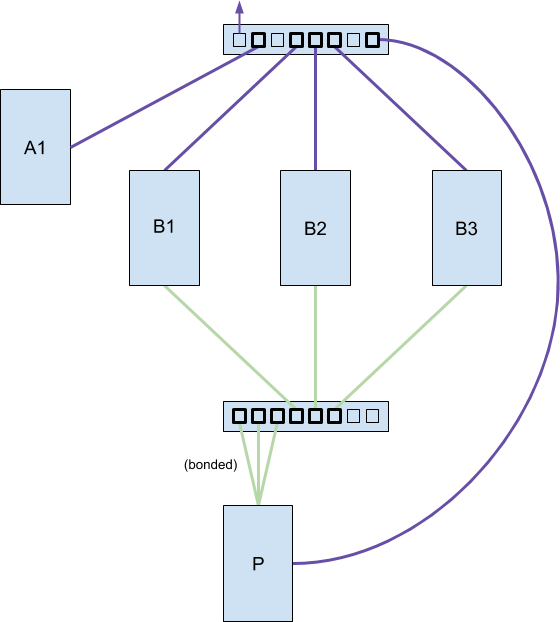
The Sensu Testbed is comprised of five bare metal hosts and two gigabit ethernet network switches. Bare metal is used for increased control and consistency between testing runs (single tenant, no hypervisor, etc.). One host is for running thousands of Sensu Agent sessions (A1), three hosts are for running the Sensu Backend cluster (B1, B2, B3), and the final host runs Postgres for the Sensu Enterprise Event Store (P). One of the network switches is used for SSH access to each host and the Sensu Agent sessions traffic to the Backends. The other network switch is used for Sensu Backend etcd and Postgres traffic. The Postgres host uses three 1 gigabit ethernet cards, round-robin bonded (bond0), to increase its network bandwidth.
-
AMD Ryzen Threadripper 2990WX Processor, 32 Cores, 3.0 GHz, 83MB Cache
-
Gigabyte X399 AORUS PRO, DDR4 2666MHz, Triple M.2
-
Corsair Vengeance LPX 32GB DDR4 2666MHz CL16 Quad Channel Kit (4x 8GB)
-
Intel 660p Series M.2 PCIe 512GB Solid State Drive
-
GeForce GT 710, 1GB DDR3
-
Cooler Master Wraith Ripper Ryzen ThreadRipper CPU Cooler
-
EVGA SuperNOVA 850W Power Supply
-
Cooler Master MasterCase H500P Mesh E-ATX Case
-
AMD Ryzen Threadripper 2920X Processor, 12 Cores, 3.5GHz, 39MB Cache
-
Gigabyte X399 AORUS PRO, DDR4 2666MHz, Triple M.2
-
Corsair Vengeance LPX 16GB DDR4 2666MHz CL16 Dual Channel Kit (2x 8GB)
-
Two Intel 660p Series M.2 PCIe 512GB Solid State Drives
-
Intel Gigabit CT PCIe Network Card
-
GeForce GT 710, 1GB DDR3
-
Noctua NH-U12S TR4-SP3 CPU Cooler
-
Corsair CX Series 650W Power Supply
-
Corsair Carbide Series 270R Mid Tower ATX Case
-
AMD Ryzen Threadripper 2920X Processor, 12 Cores, 3.5GHz, 39MB Cache
-
Gigabyte X399 AORUS PRO, DDR4 2666MHz, Triple M.2
-
Corsair Vengeance LPX 16GB DDR4 2666MHz CL16 Dual Channel Kit (2x 8GB)
-
Two Intel 660p Series M.2 PCIe 512GB Solid State Drives
-
Samsung 970 PRO NVMe M.2 PCIe 1TB Solid State Drive
-
Three Intel Gigabit CT PCIe Network Cards
-
GeForce GT 710, 1GB DDR3
-
Noctua NH-U12S TR4-SP3 CPU Cooler
-
Antec Earthwatts EA-500D 500w Power Supply
-
Antec Design Sonata Mid Tower ATX Case
-
Two Ubiquiti UniFi 8 Port 60W Switches (US-8-60W)
-
Eleven Cat 6 5ft Ethernet Cables
-
An Intel 660p 512GB SSD for the root and var partitions
-
Disabled TCP syn cookies (net.ipv4.tcp_syncookies = 0)
-
An Intel 660p 512GB SSD for the Postgres wal, XFS, 4k block size, mounted with noatime and nodiratime
-
A Samsung 970 PRO 1TB SSD for the Postgres database, XFS, 4k block size, mounted with noatime and nodiratime
max_connections = 200

shared_buffers = 10GB

maintenance_work_mem = 1GB

vacuum_cost_delay = 0
vacuum_cost_limit = 10000

bgwriter_delay = 50ms
bgwriter_lru_maxpages = 1000

max_worker_processes = 8
max_parallel_maintenance_workers = 2
max_parallel_workers_per_gather = 2
max_parallel_workers = 8

synchronous_commit = off

wal_sync_method = fdatasync
wal_writer_delay = 5000ms
max_wal_size = 5GB
min_wal_size = 1GB

checkpoint_completion_target = 0.9

autovacuum_max_workers = 5
autovacuum_naptime = 1s
autovacuum_vacuum_scale_factor = 0.05
autovacuum_analyze_scale_factor = 0.025
- An Intel 660p 512GB SSD for the Sensu Backend embedded etcd (wal and data), ext4 (defaults)
The following steps are intended for Sensu Engineering use, they are shared here for transparency.
Connect to the SSH jump host via DNS: spdc.sensu.io.
If that fails check the pins in the #engineering channel in Slack for the IP
Wake the Testbed from the SSH jump host:
./wake.sh
Start up Postgres and do some cleanup:
ssh root@postgres

systemctl start postgresql

systemctl status postgresql

systemctl start postgres-exporter.service

systemctl status postgres-exporter.service

psql -U postgres

DROP DATABASE sensu;
VACUUM FULL;

CREATE DATABASE sensu;
GRANT ALL PRIVILEGES ON DATABASE sensu TO sensu;

\q
Wipe Sensu Backends and start them up (do these steps on all three backends):
ssh root@backend1

rm -rf /mnt/data/sensu/sensu-backend
If the version you're testing is not installed:
./backend_upgrade.sh $SHA $BRANCH
If the version you're testing is already installed:
systemctl start sensu-backend.service

systemctl status sensu-backend.service
Initialize the cluster admin user and configure the Enterprise license and Postgres Event Store (from backend1):
ssh root@backend1

sensu-backend init --cluster-admin-username admin --cluster-admin-password P@ssw0rd!

sensuctl configure -n --username admin --password P@ssw0rd!

sensuctl create -f sensu-perf/license.json

sensuctl create -f sensu-perf/postgres.yml
In either separate SSH sessions, tmux, or screen panes, on agents1 run all of the following scripts, each one in a seperate instance:
ssh root@agents1

cd sensu-perf/tests/3-backends-40k-agents-4-subs-pg/

./loadit1.sh
./loadit2.sh
./loadit3.sh
./loadit4.sh
The loadit tool must continue to run for the whole duration of the performance test (do not interrupt).
Create Sensu checks that target the newly created Agent sessions (from backend1). Create all the checks in the folder:
NOTE: It is recommended to create 4 checks at a time, one for each subscription, this gives etcd some time to allocate pages etc. After etcd has had a chance to "warm up", it's generally safe to be more aggresive with check creation.
ssh root@backend1

cd sensu-perf/tests/3-backends-40k-agents-4-subs-pg/checks

ls

sensuctl create -f check1.yml && sensuctl create -f check2.yml && sensuctl create -f check3.yml && sensuctl create -f check4.yml
sensuctl create -f check5.yml && sensuctl create -f check6.yml && sensuctl create -f check7.yml && sensuctl create -f check8.yml
sensuctl create -f check9.yml && sensuctl create -f check10.yml && sensuctl create -f check11.yml && sensuctl create -f check12.yml
sensuctl create -f check13.yml && sensuctl create -f check14.yml && sensuctl create -f check15.yml && sensuctl create -f check16.yml
sensuctl create -f check17.yml && sensuctl create -f check18.yml && sensuctl create -f check19.yml && sensuctl create -f check20.yml
sensuctl create -f check21.yml && sensuctl create -f check22.yml && sensuctl create -f check23.yml && sensuctl create -f check24.yml
sensuctl create -f check25.yml && sensuctl create -f check26.yml && sensuctl create -f check27.yml && sensuctl create -f check28.yml
sensuctl create -f check29.yml && sensuctl create -f check30.yml && sensuctl create -f check31.yml && sensuctl create -f check32.yml
sensuctl create -f check33.yml && sensuctl create -f check34.yml && sensuctl create -f check35.yml && sensuctl create -f check36.yml
sensuctl create -f check37.yml && sensuctl create -f check38.yml && sensuctl create -f check39.yml && sensuctl create -f check40.yml
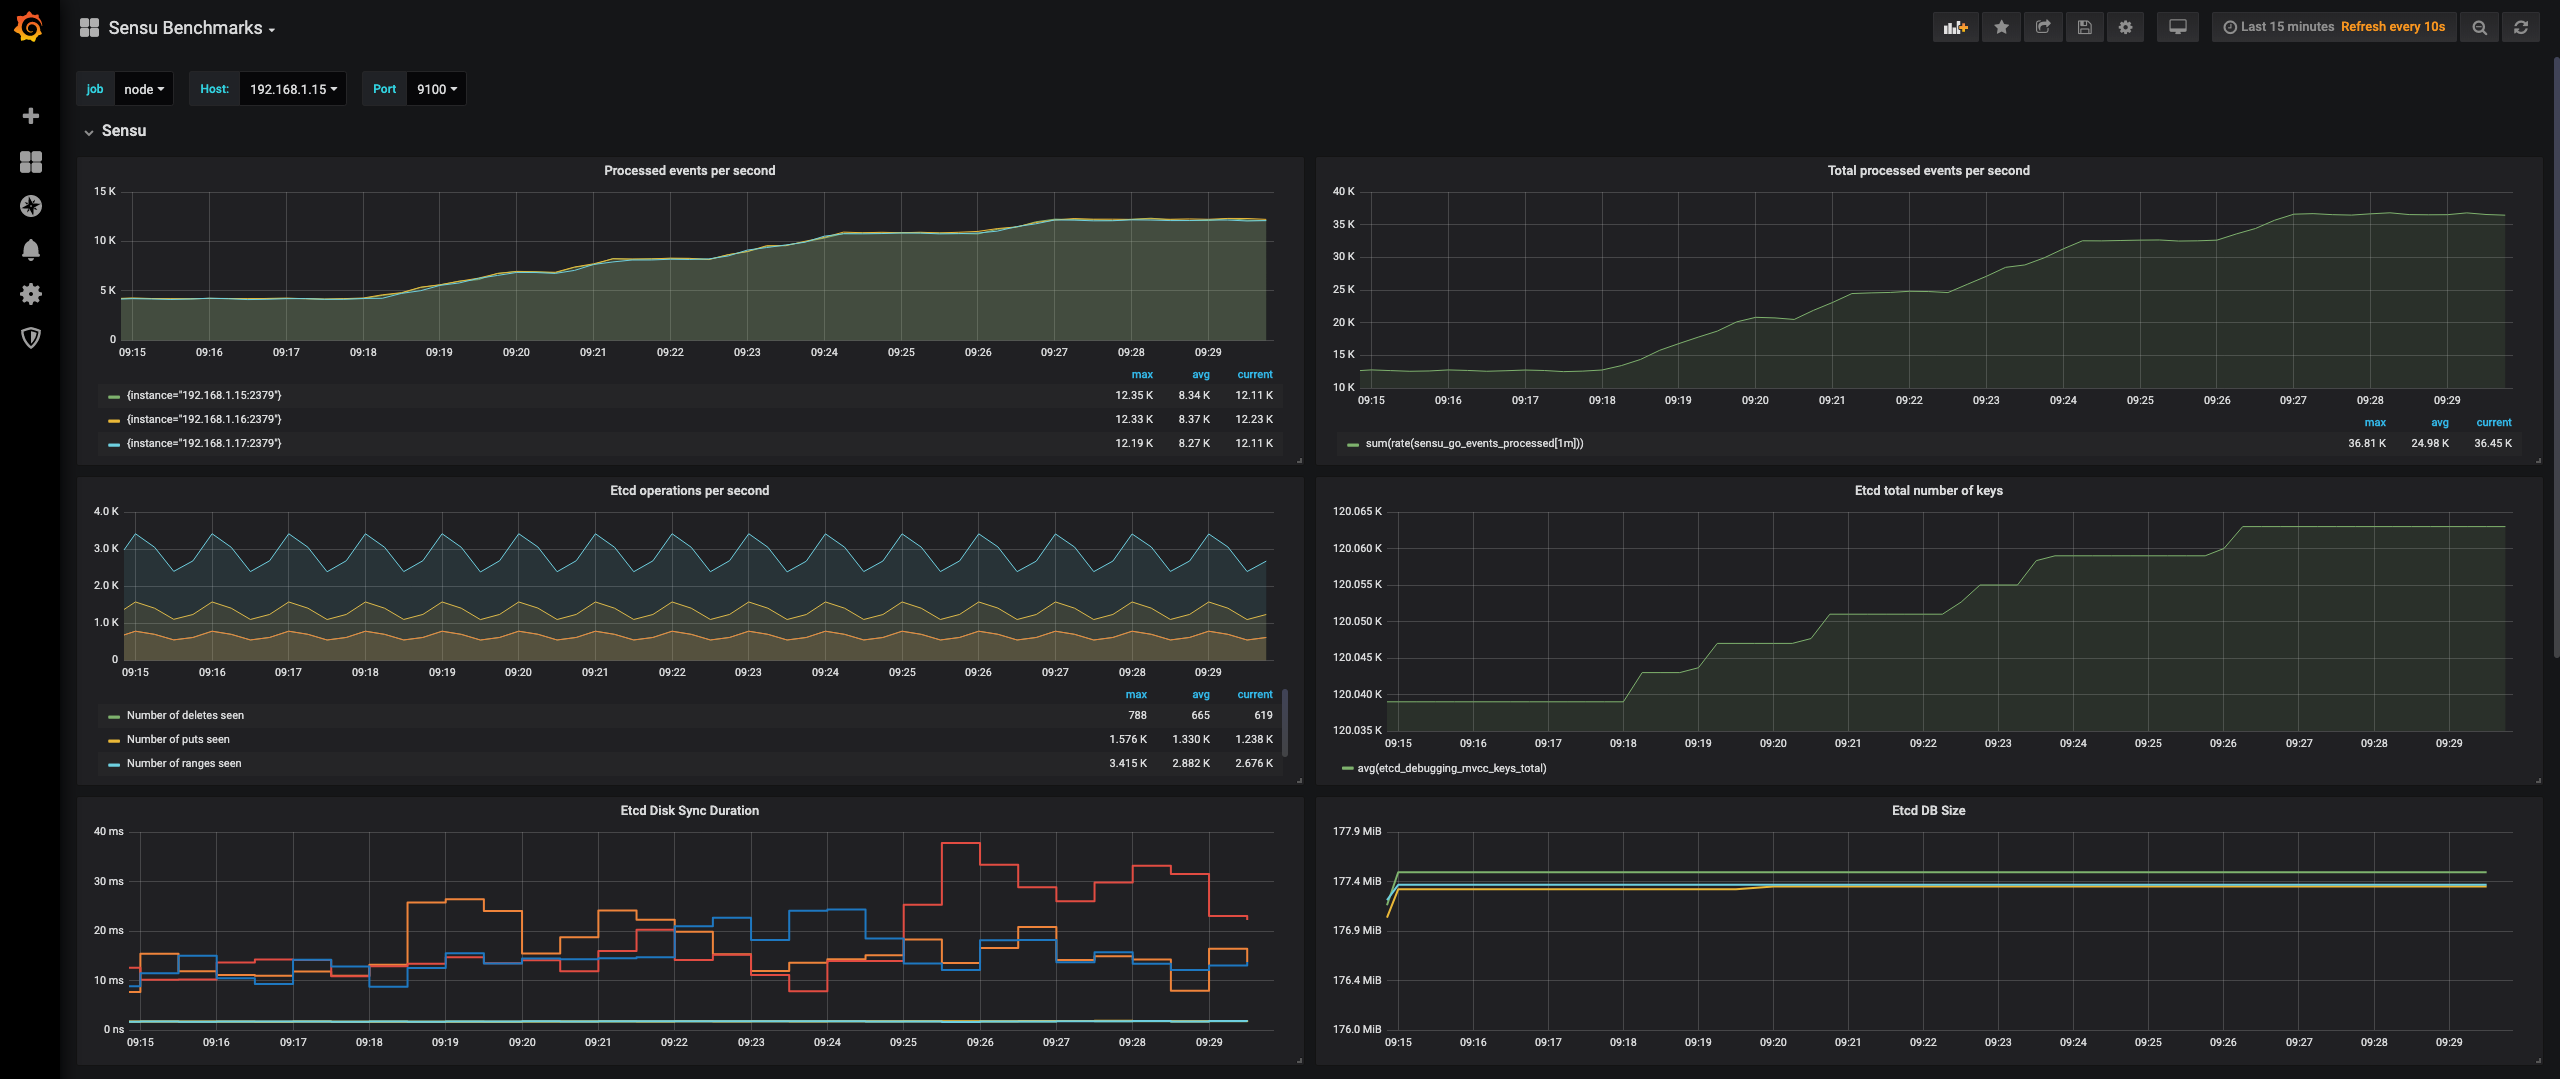
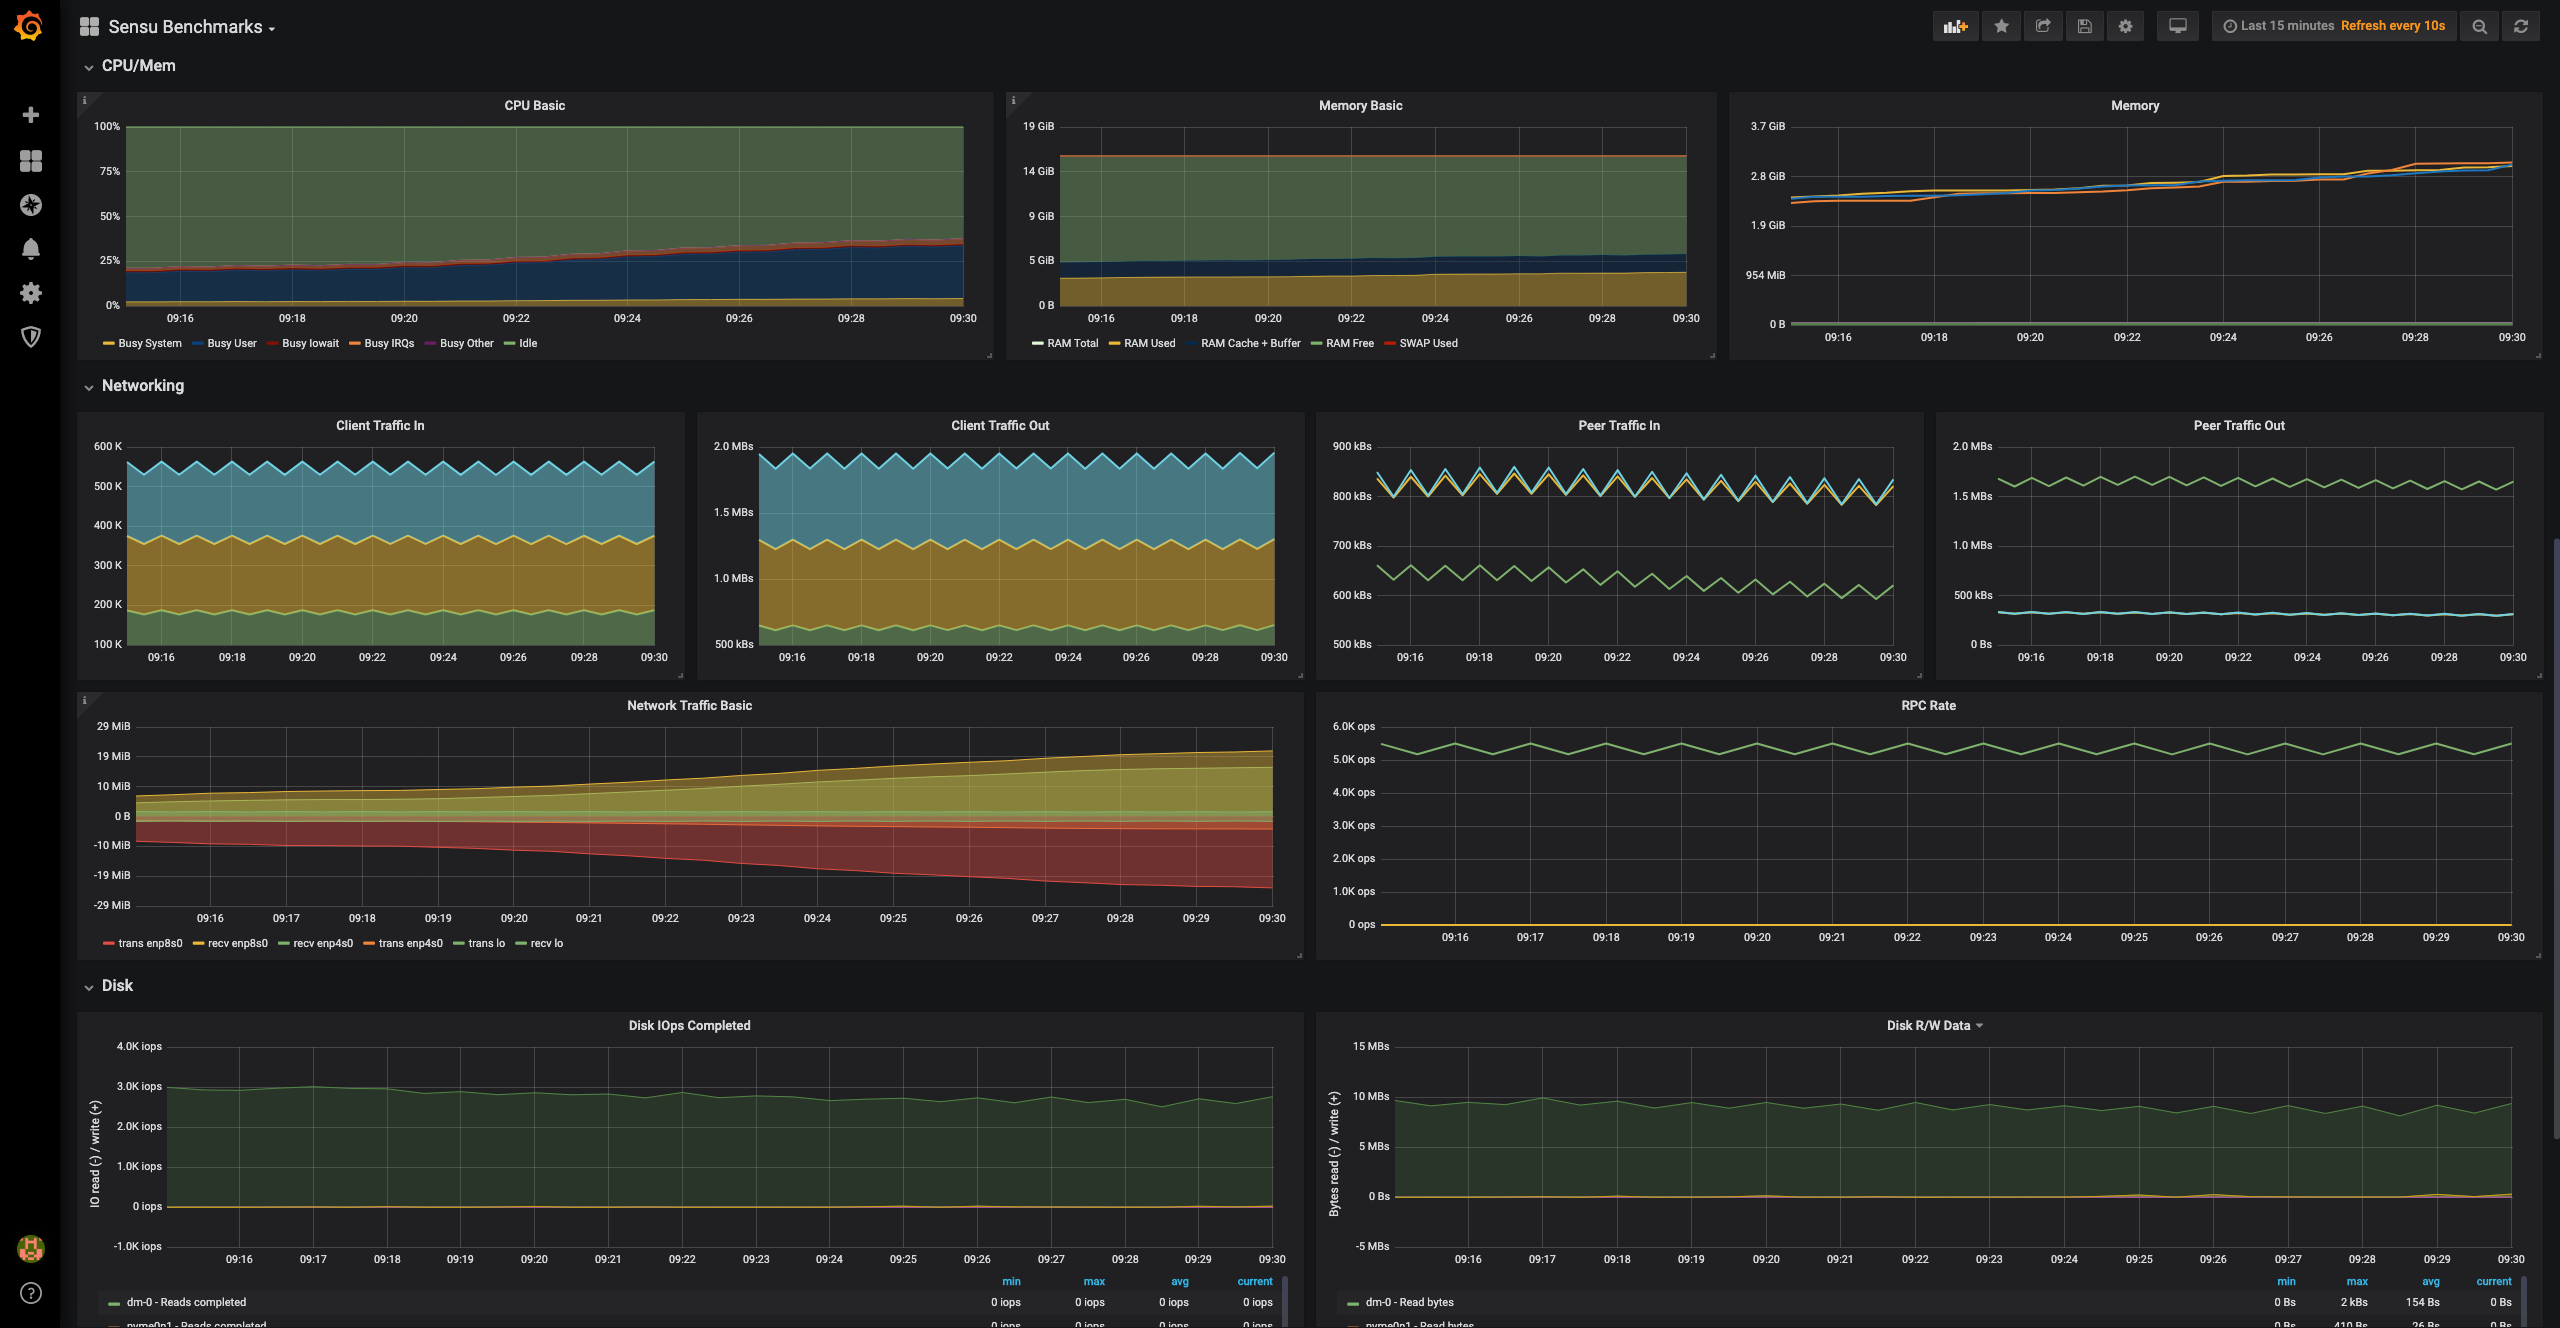
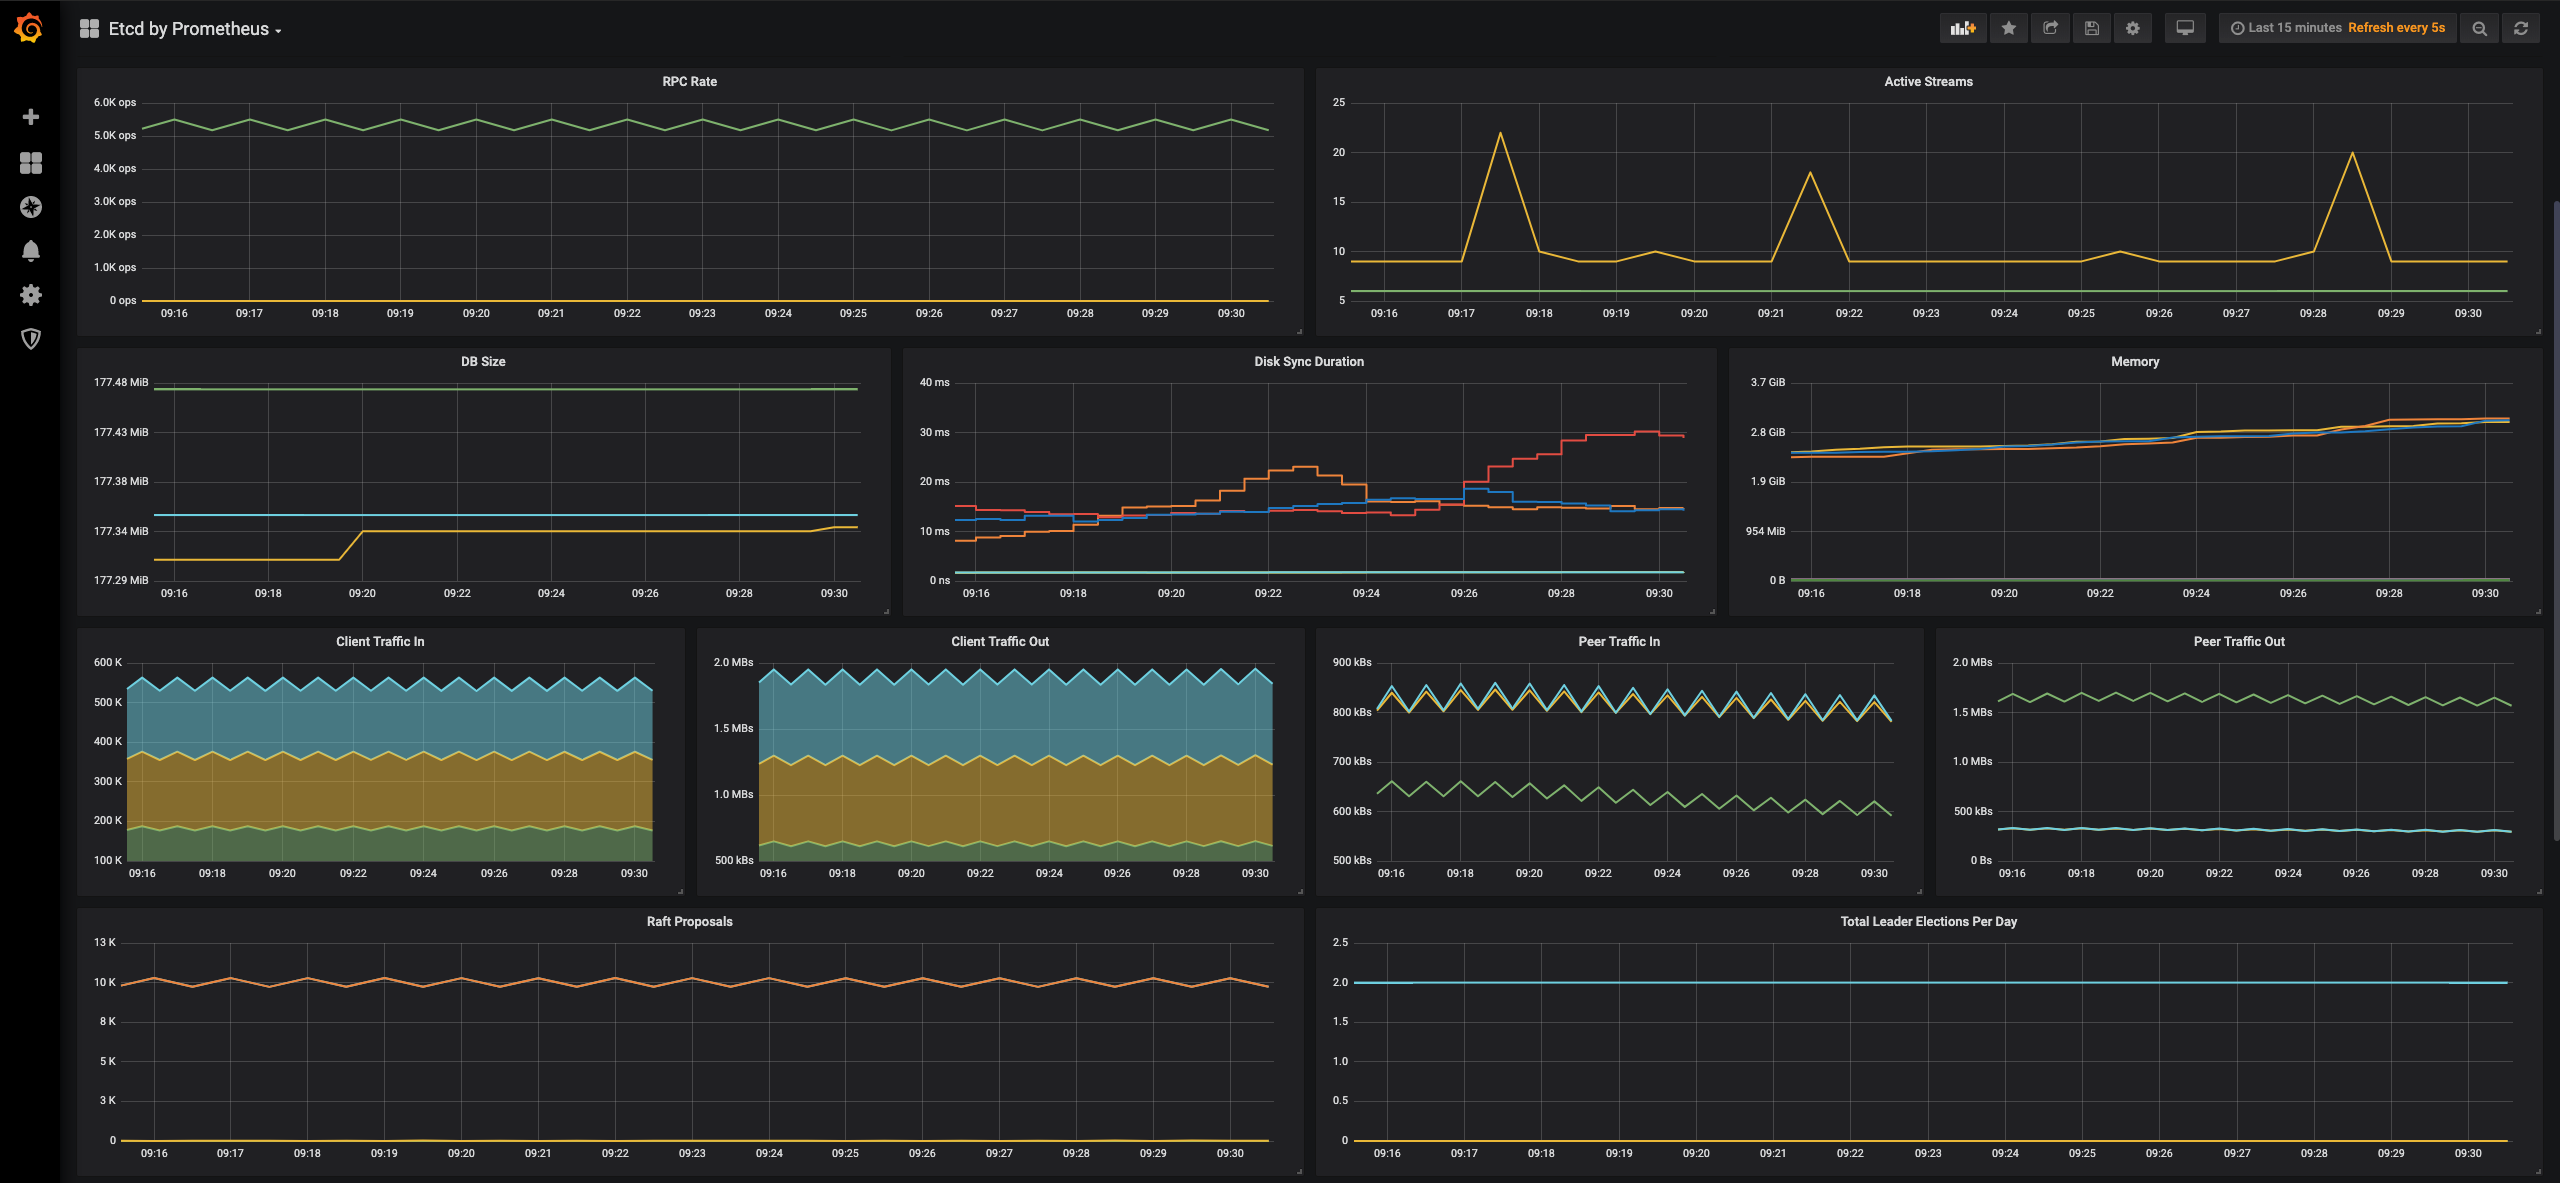
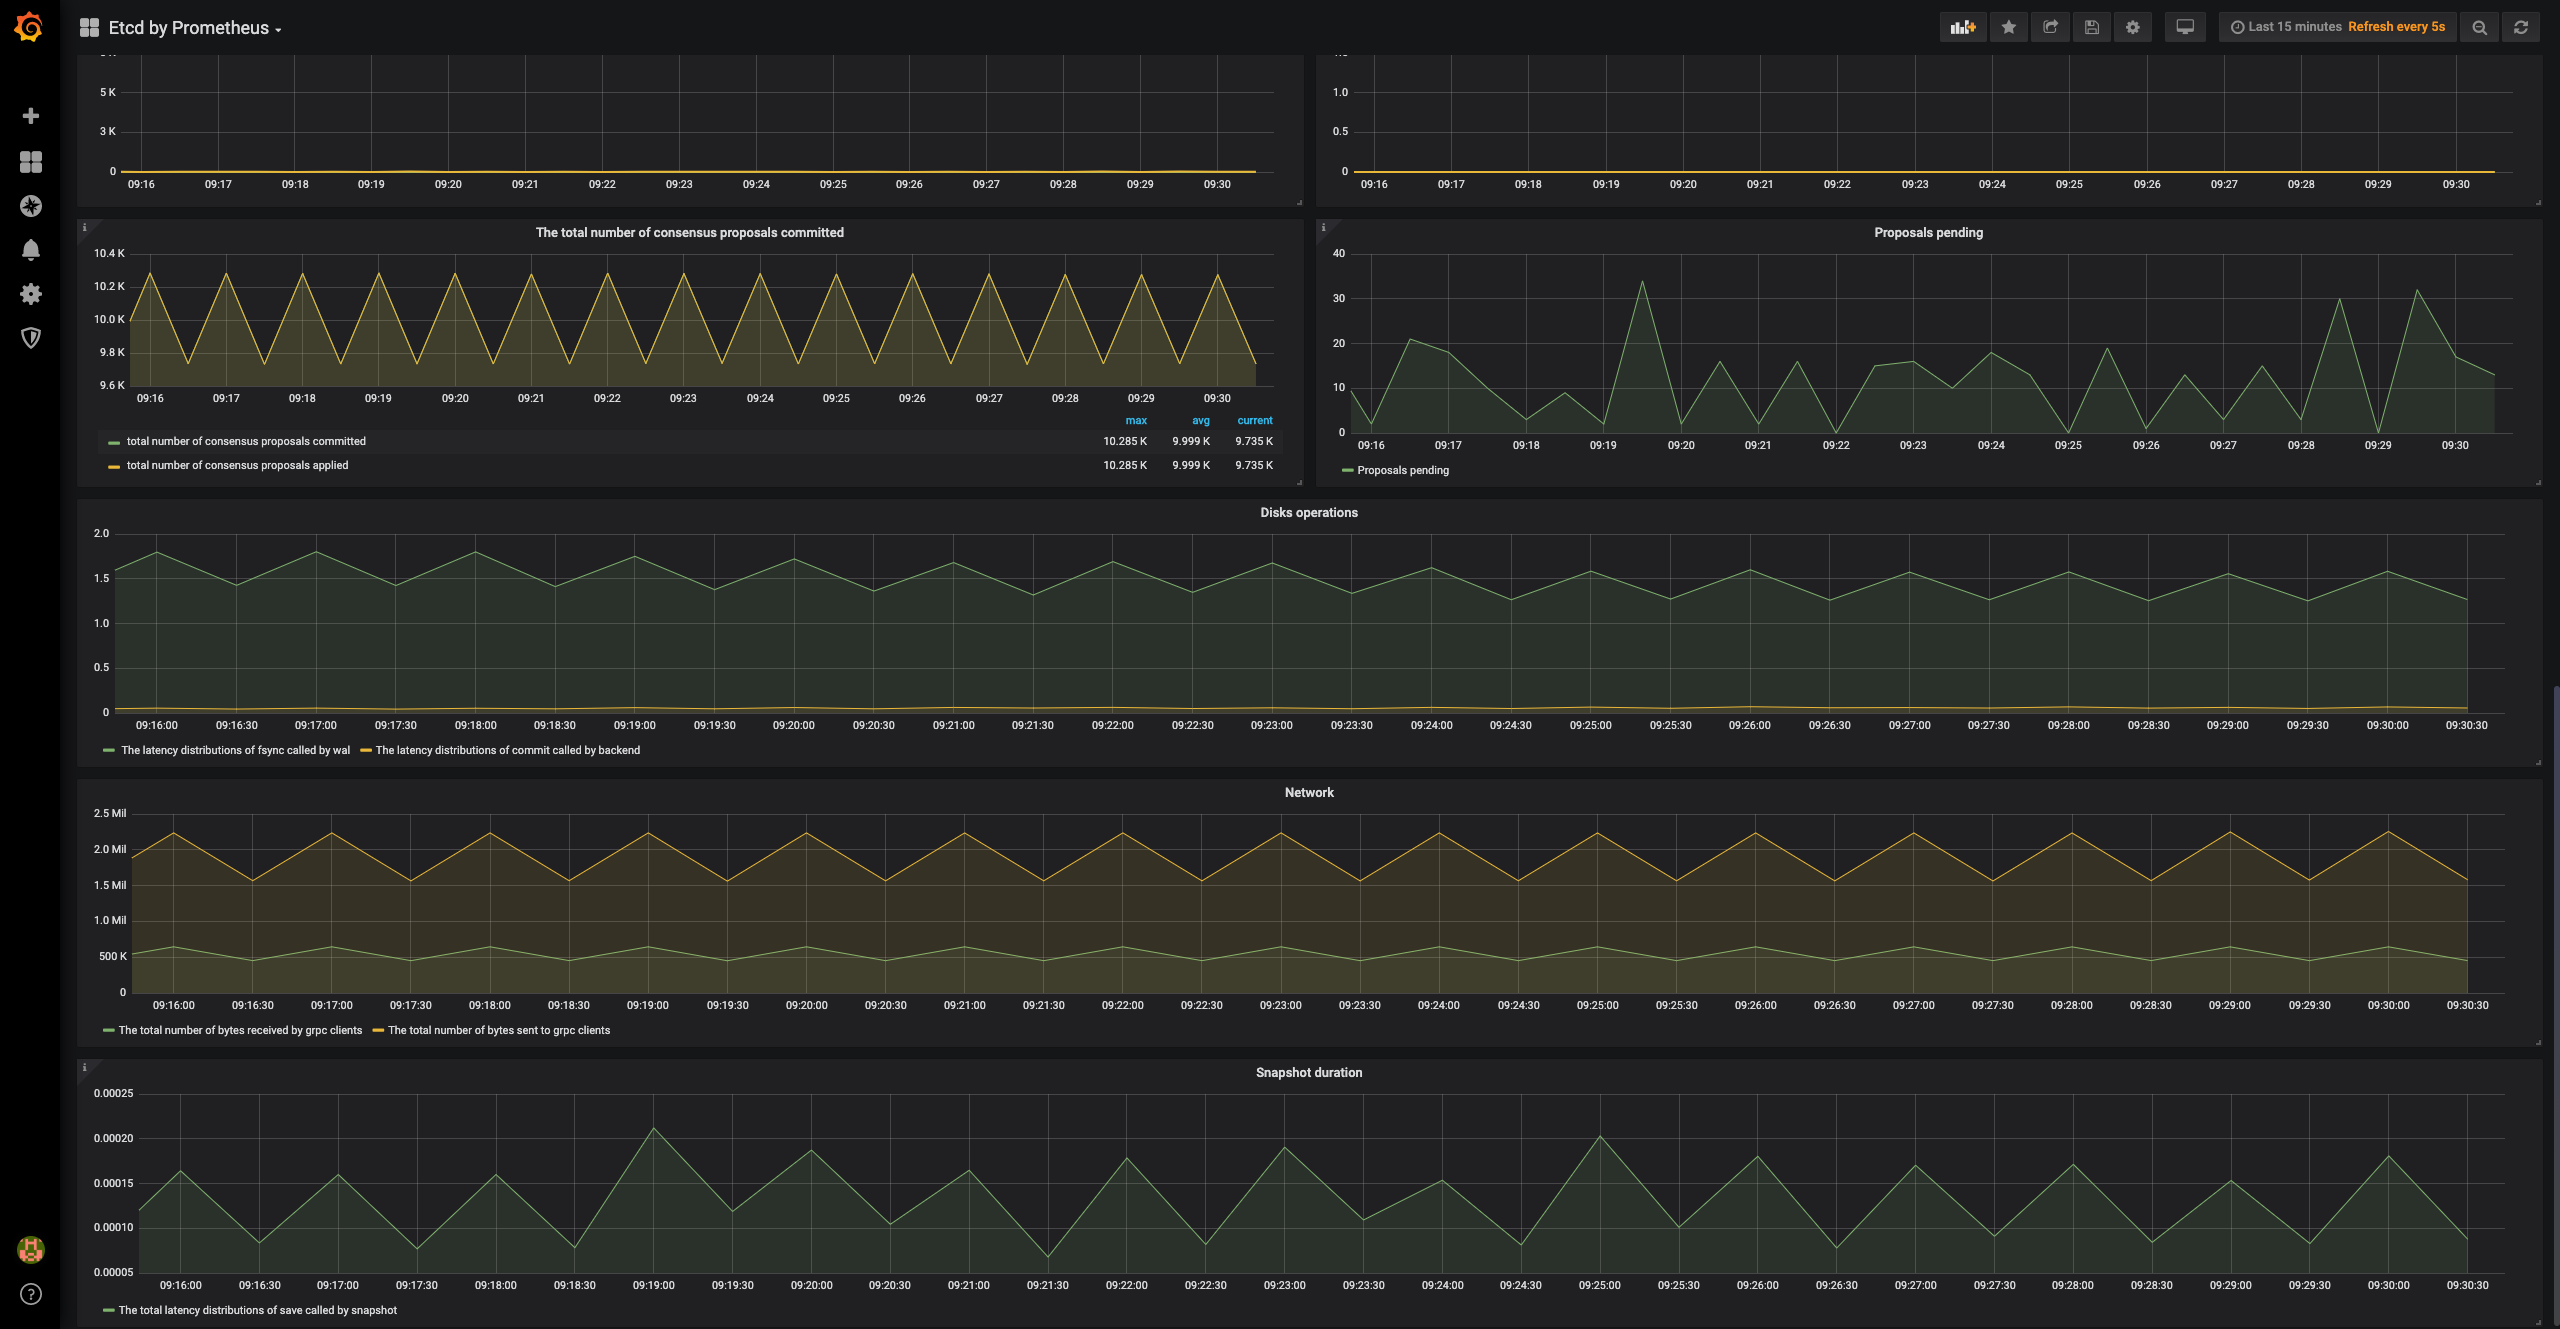
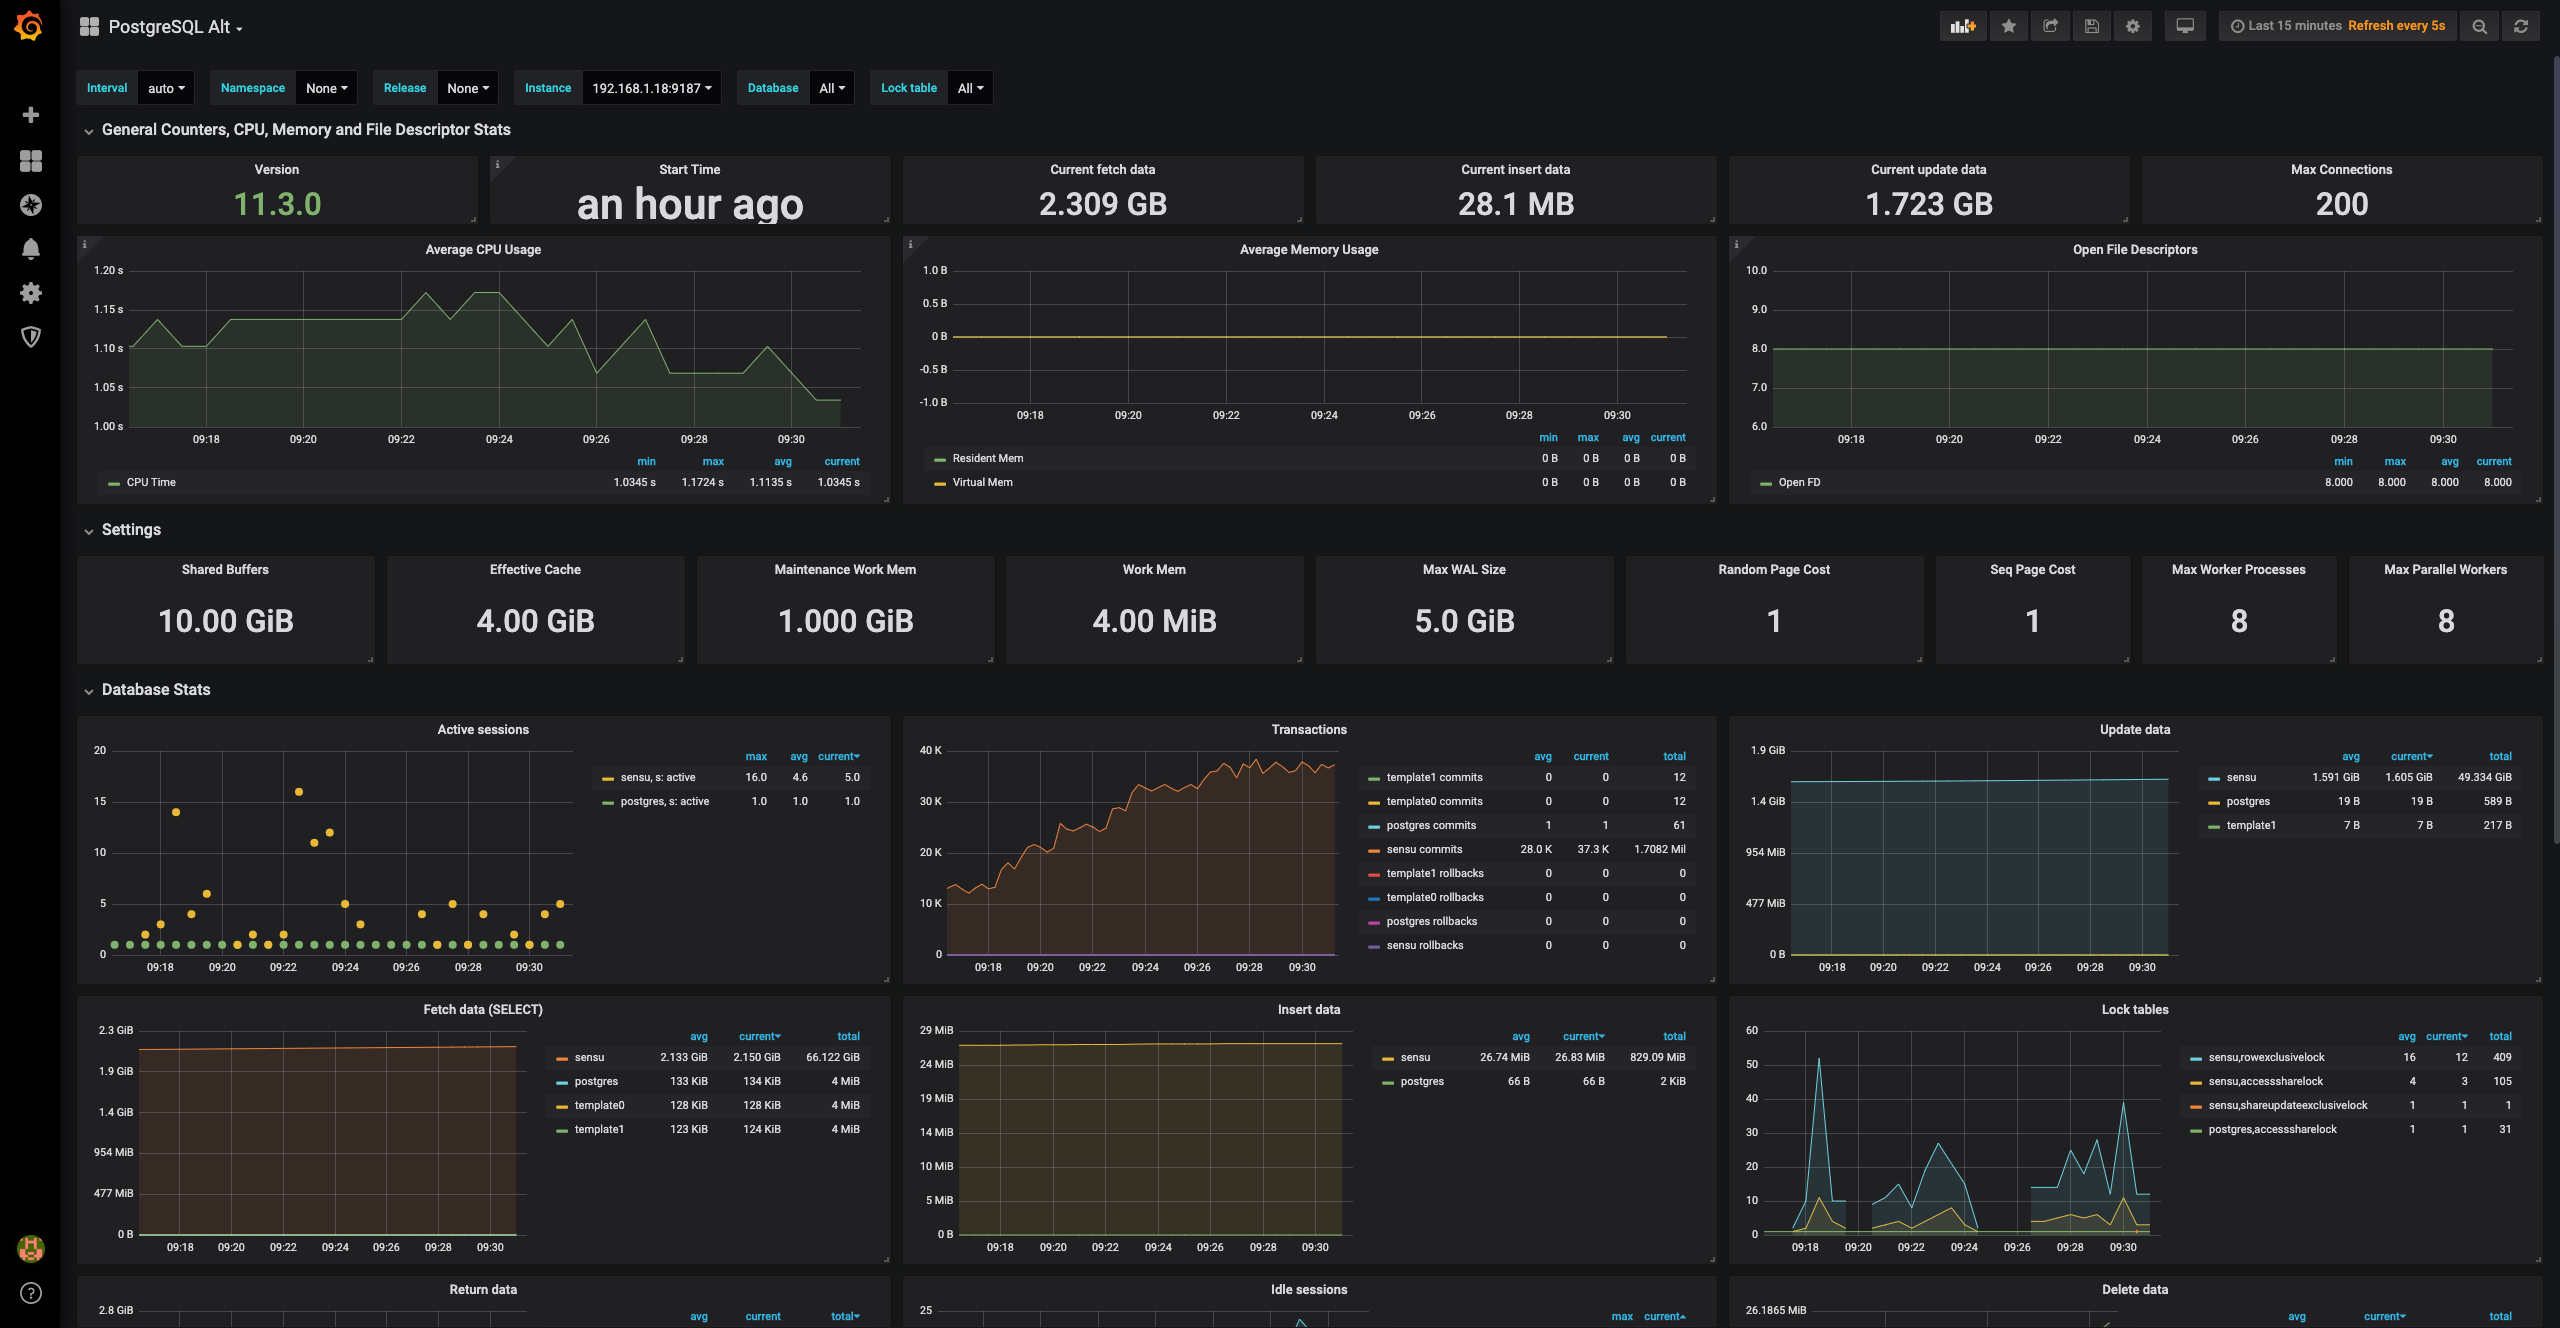
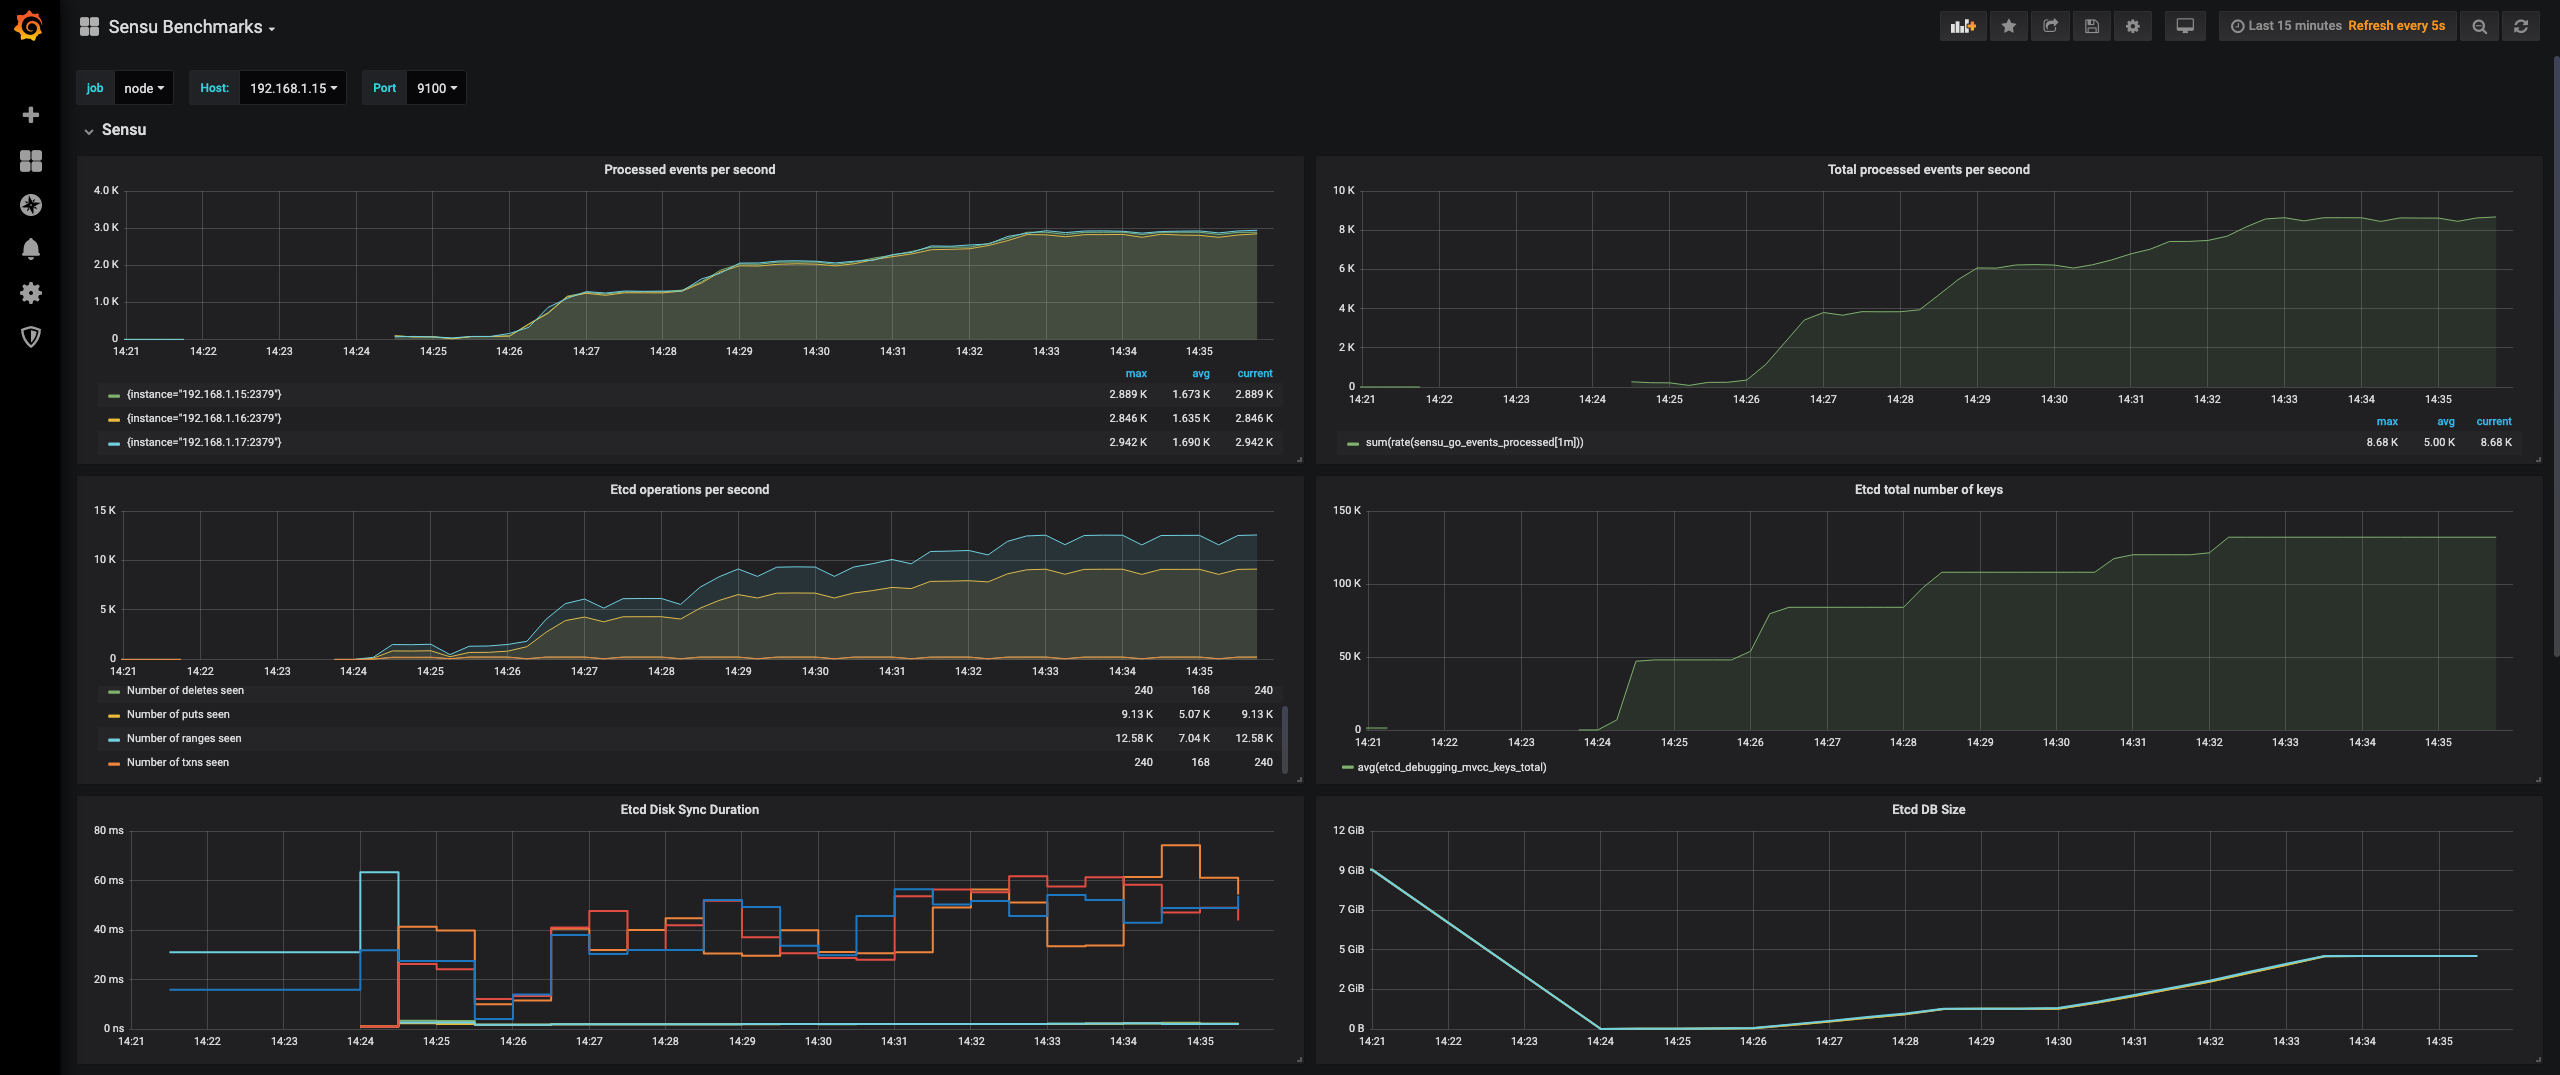
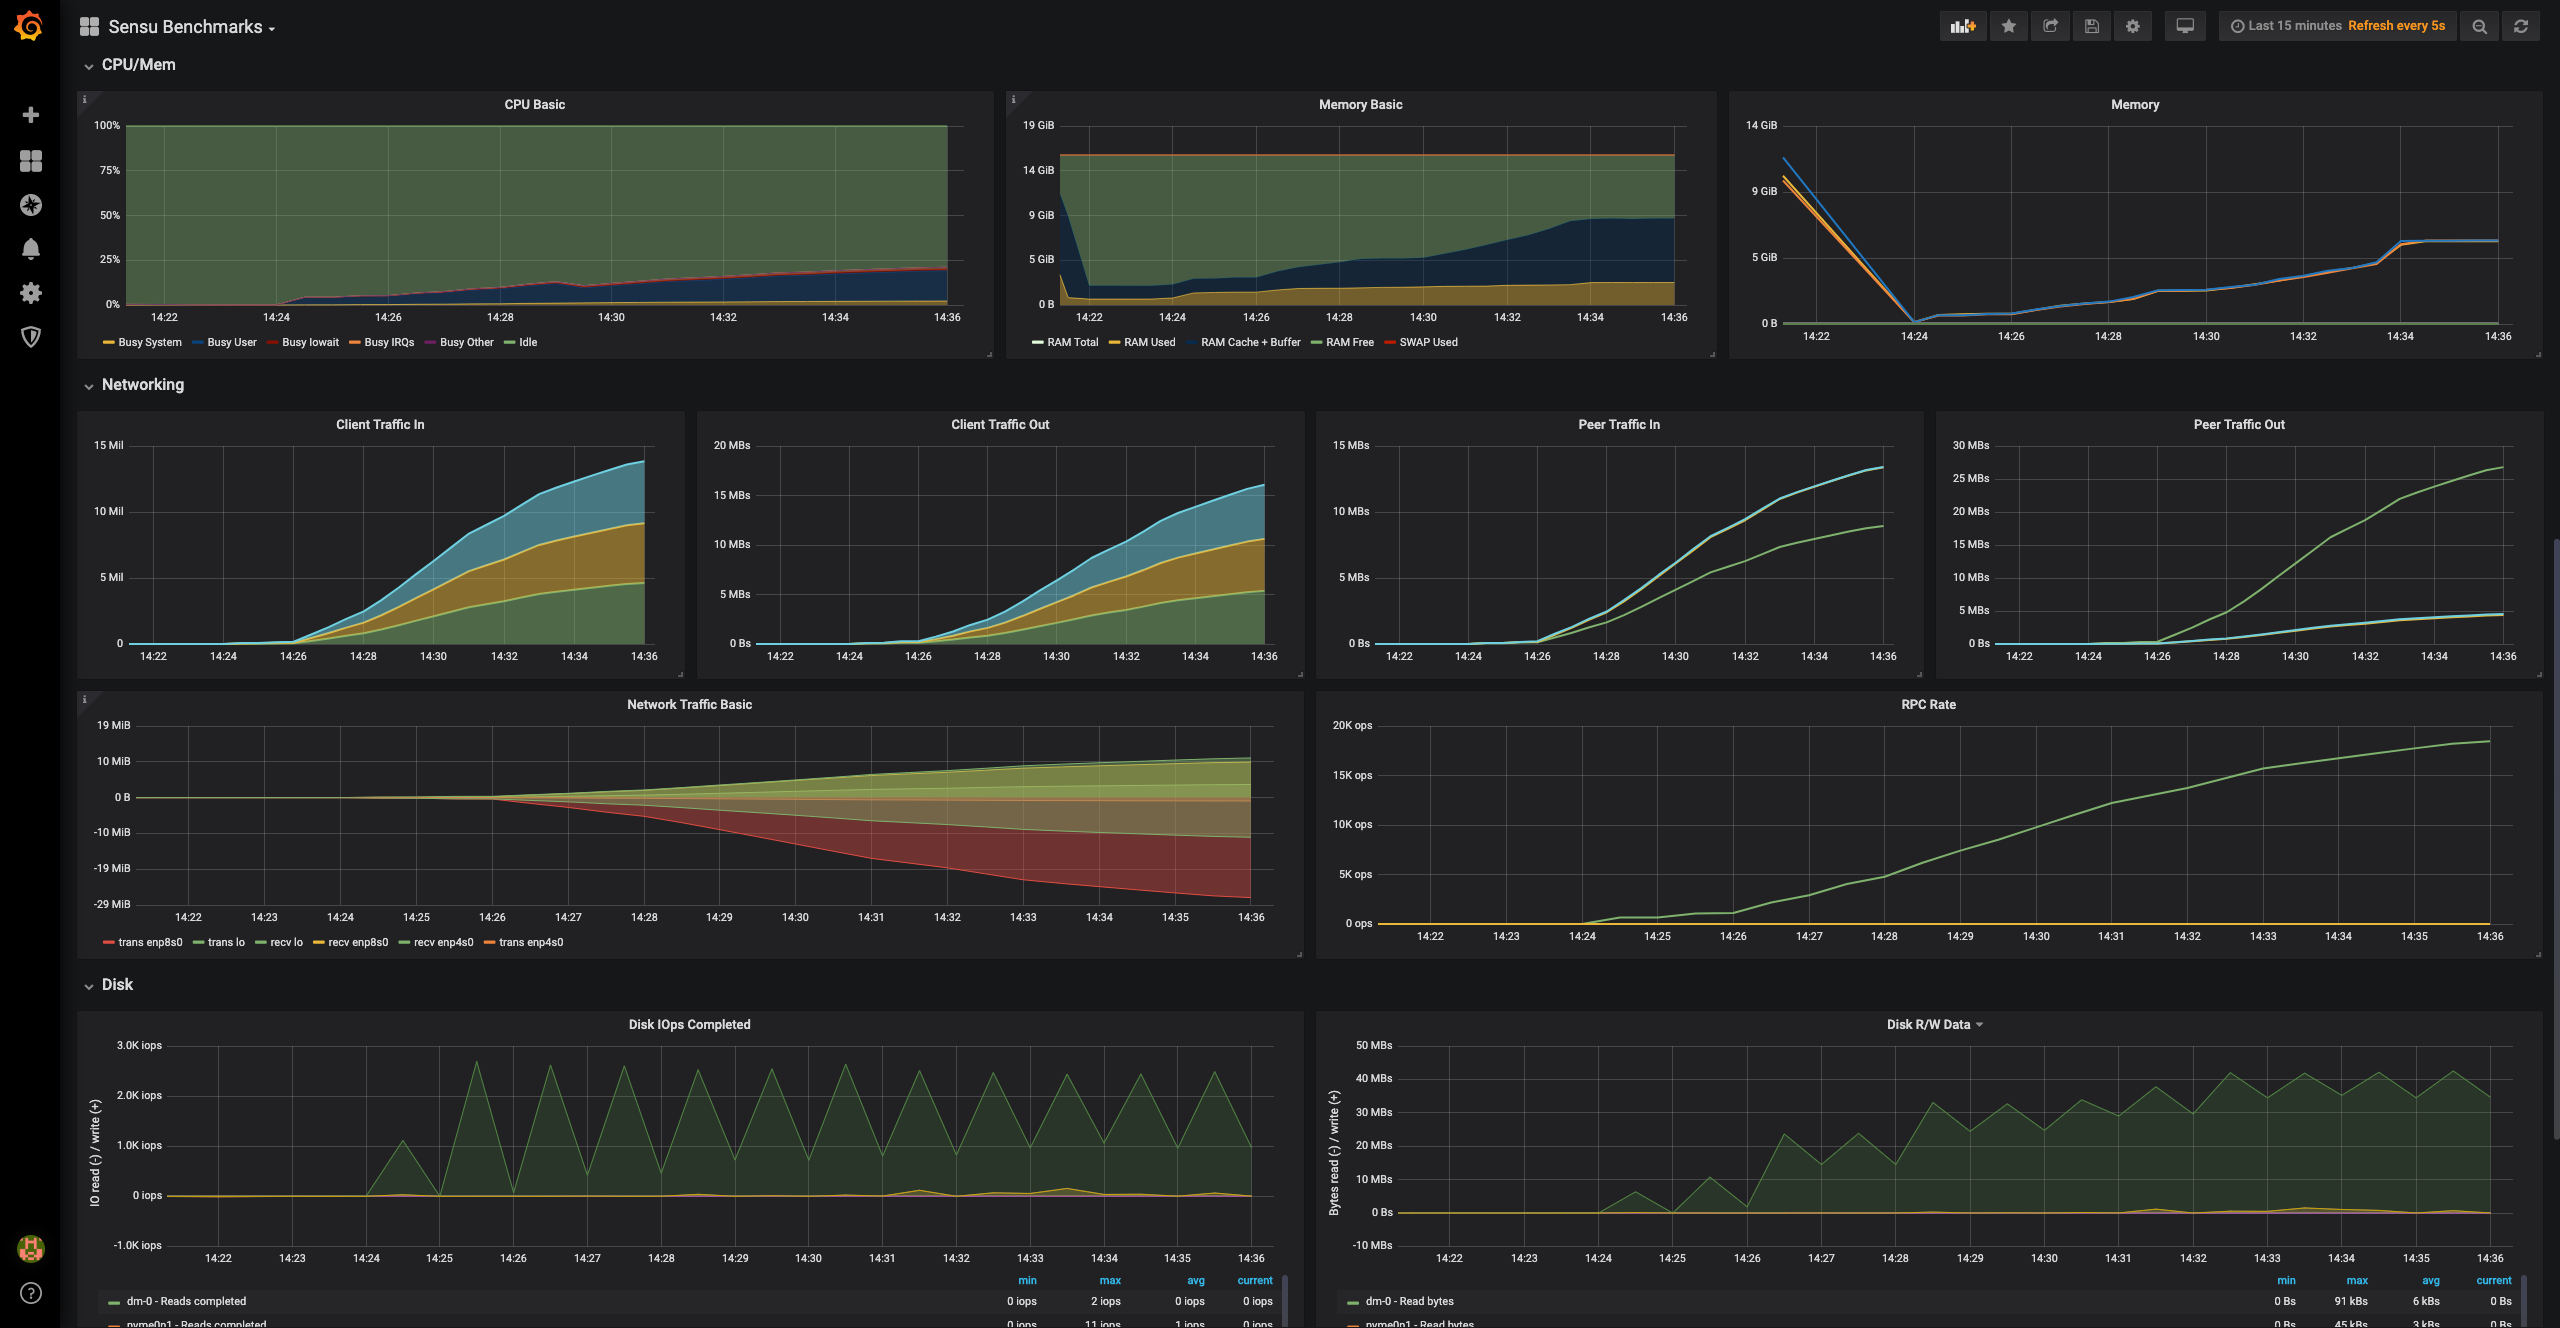
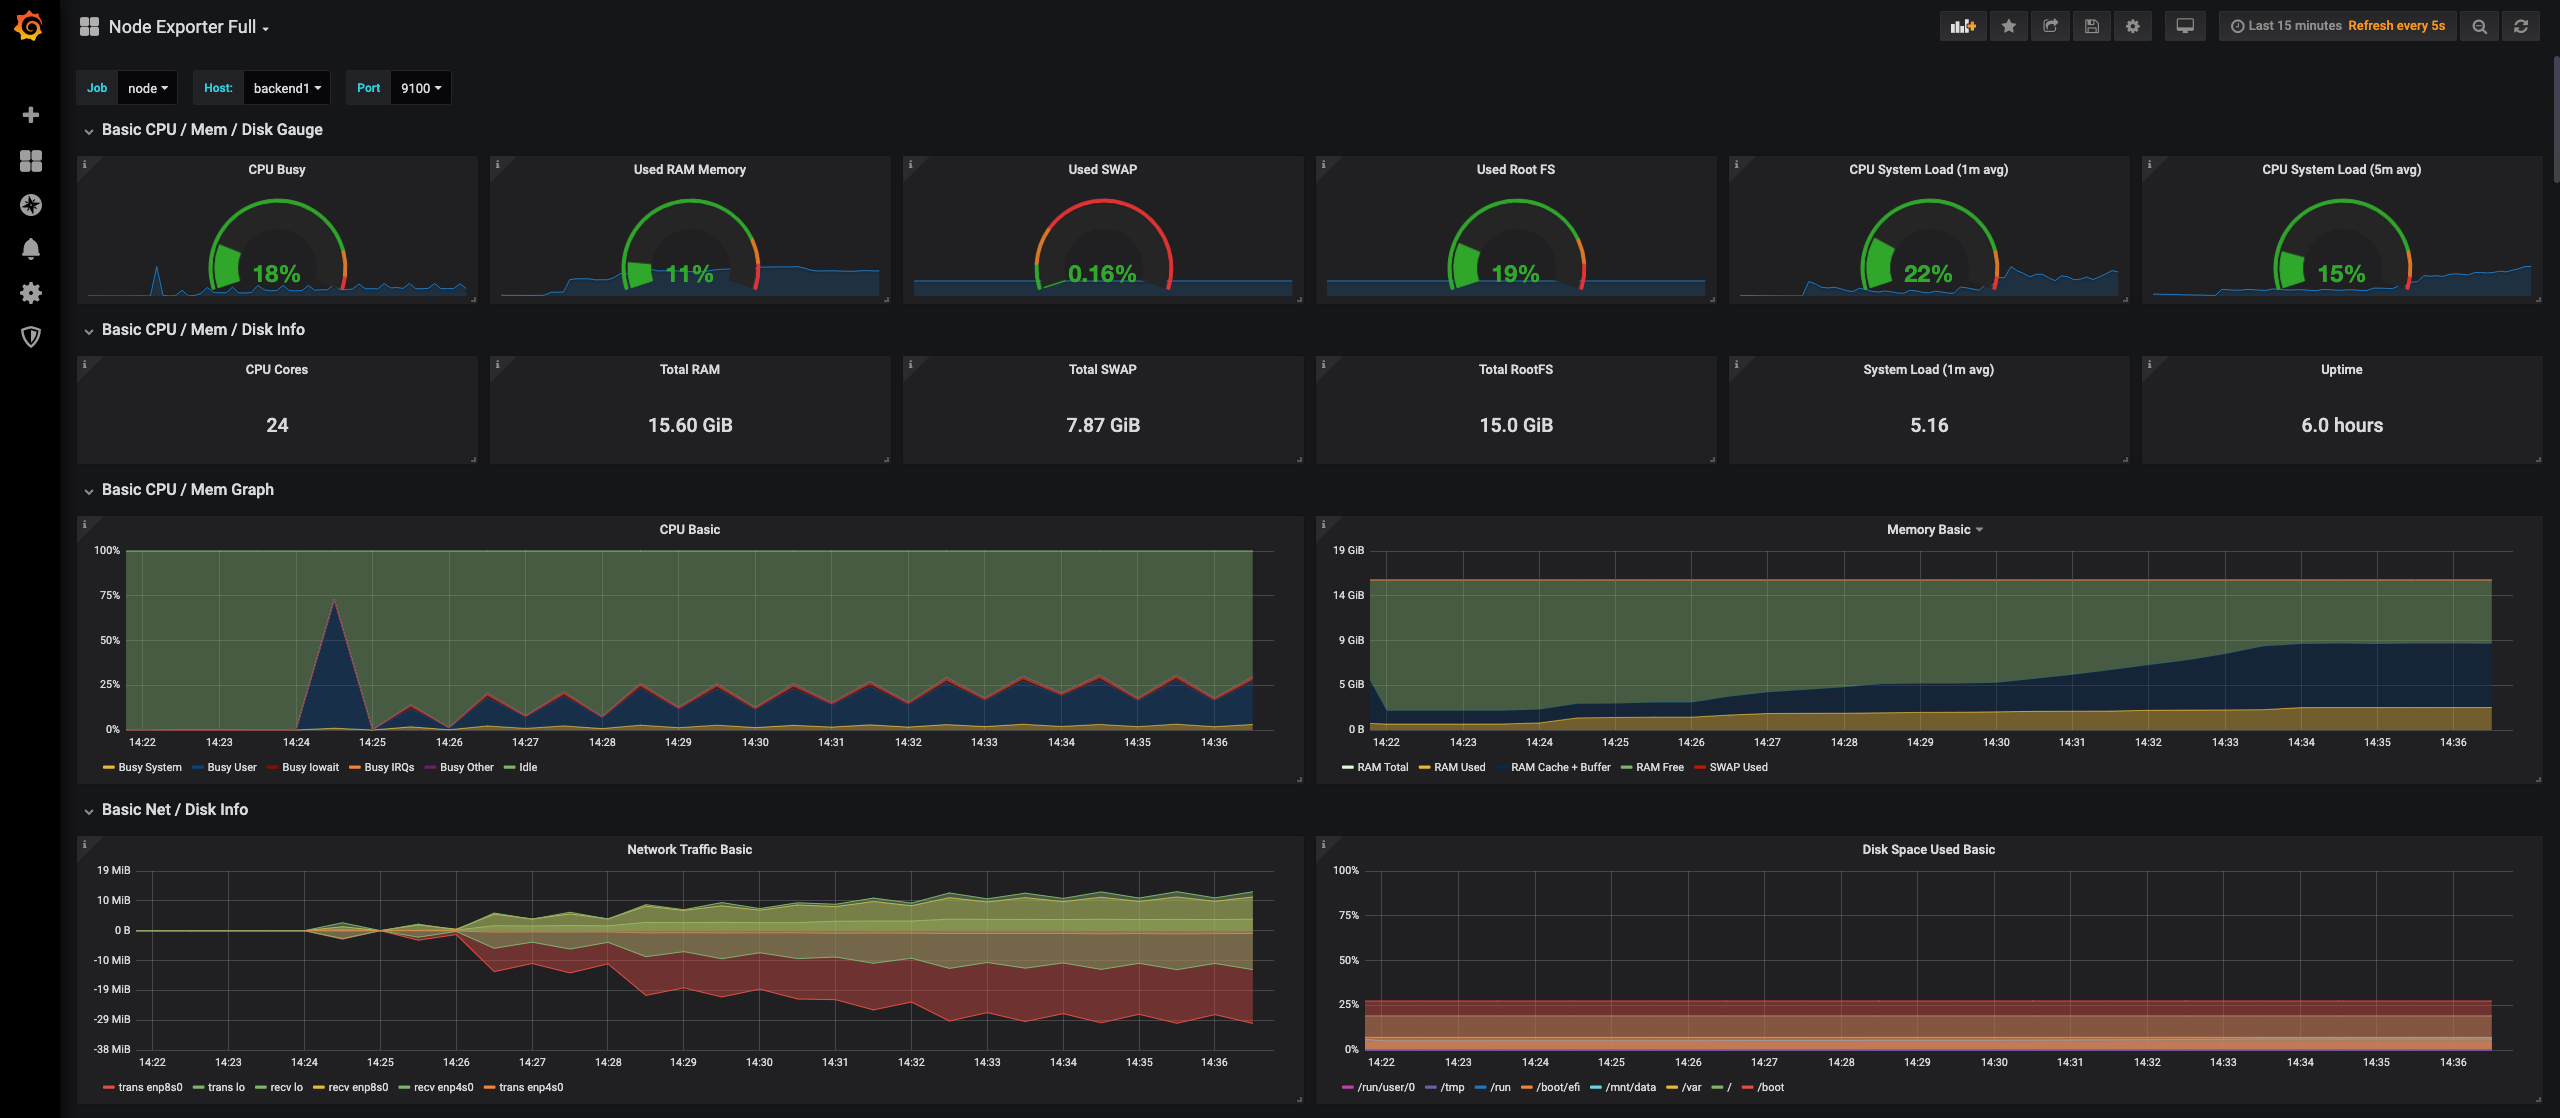
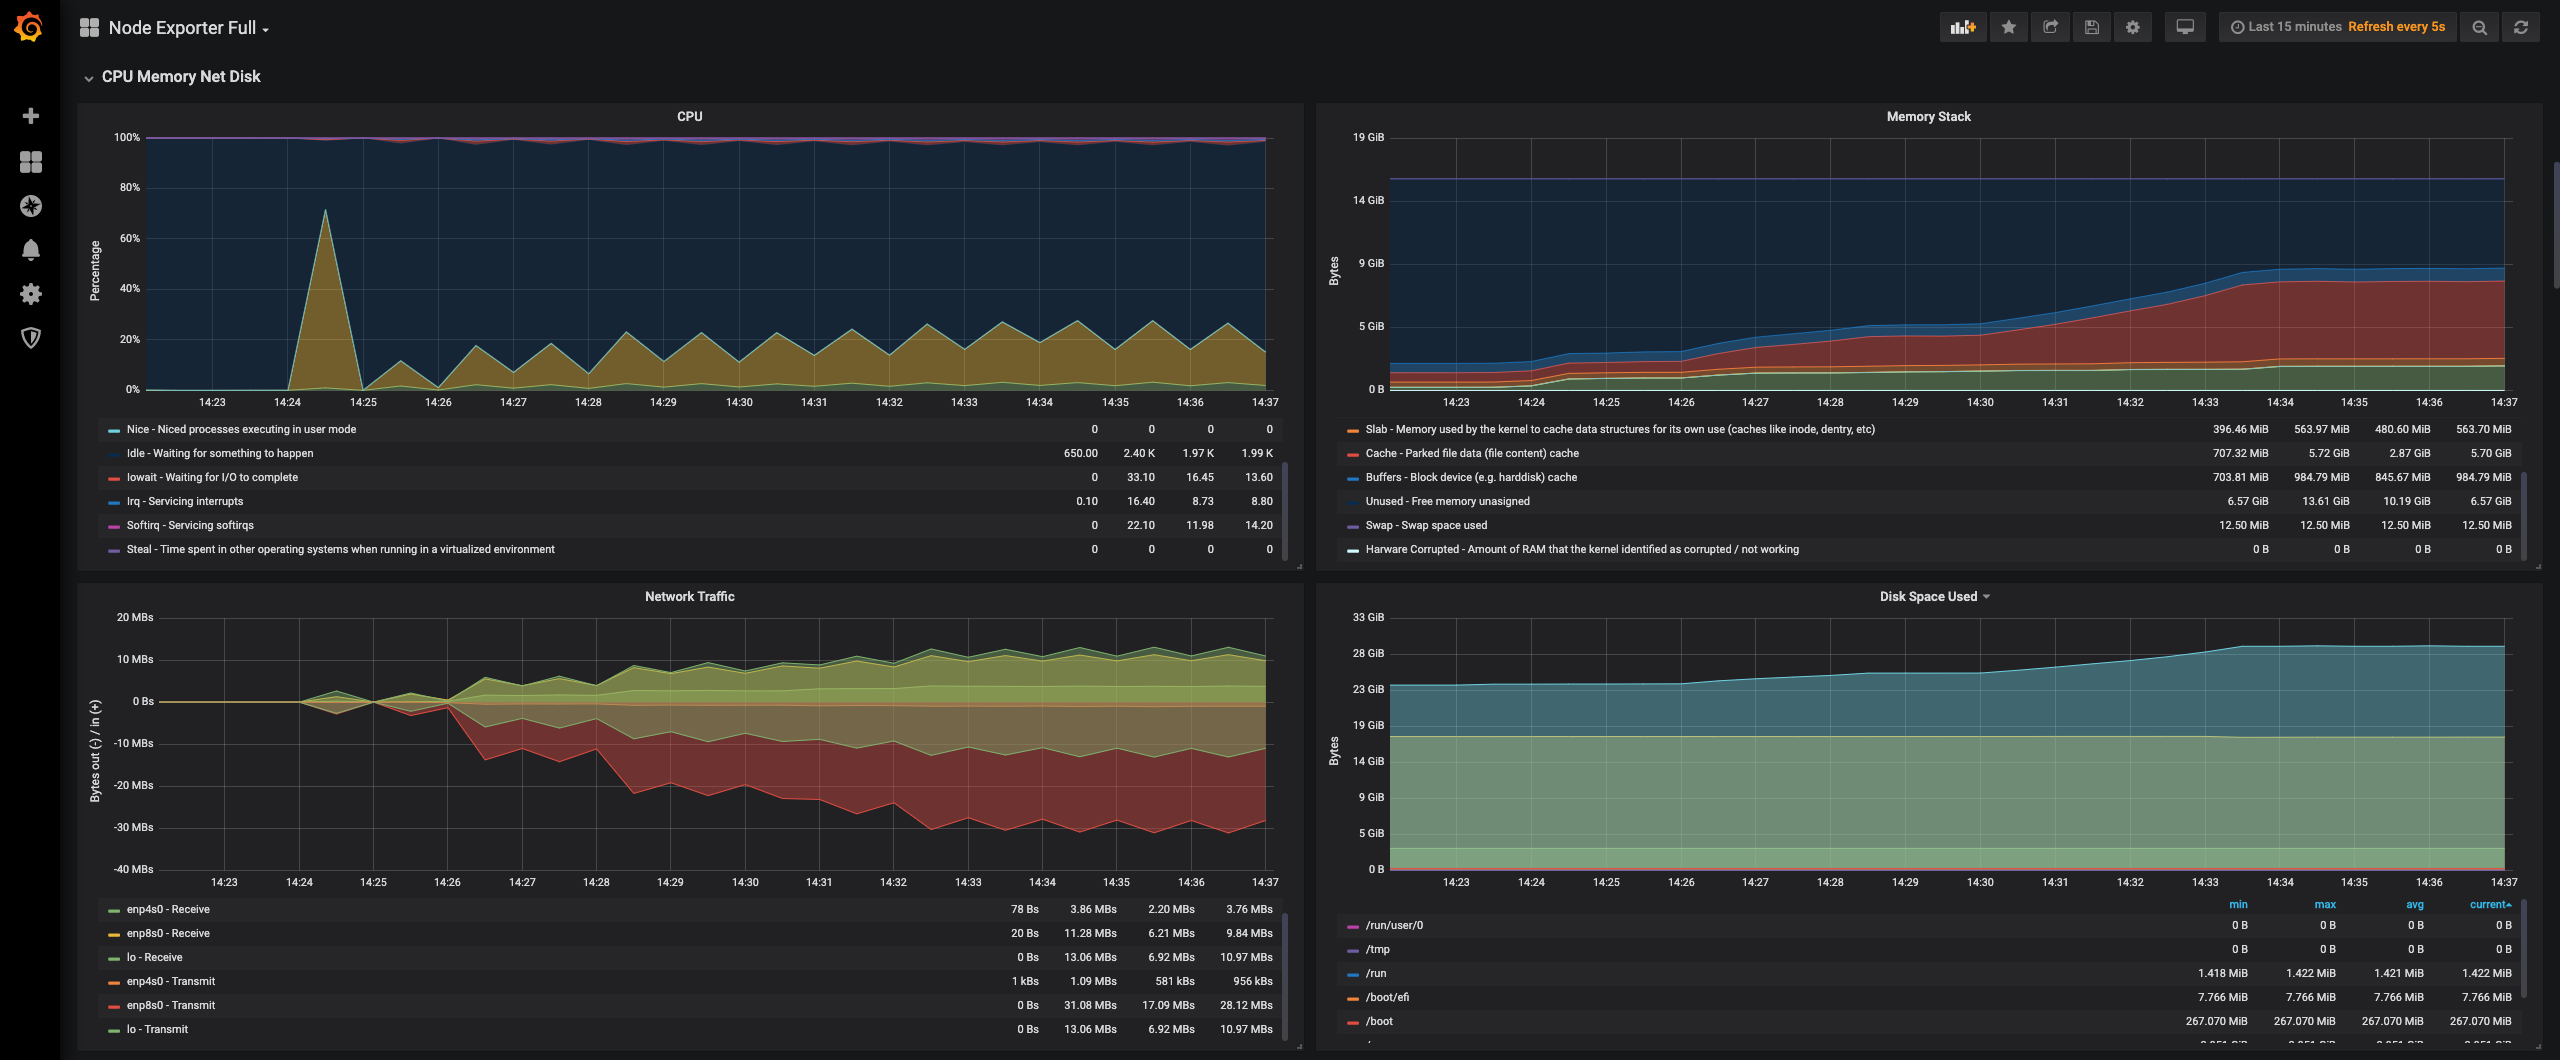
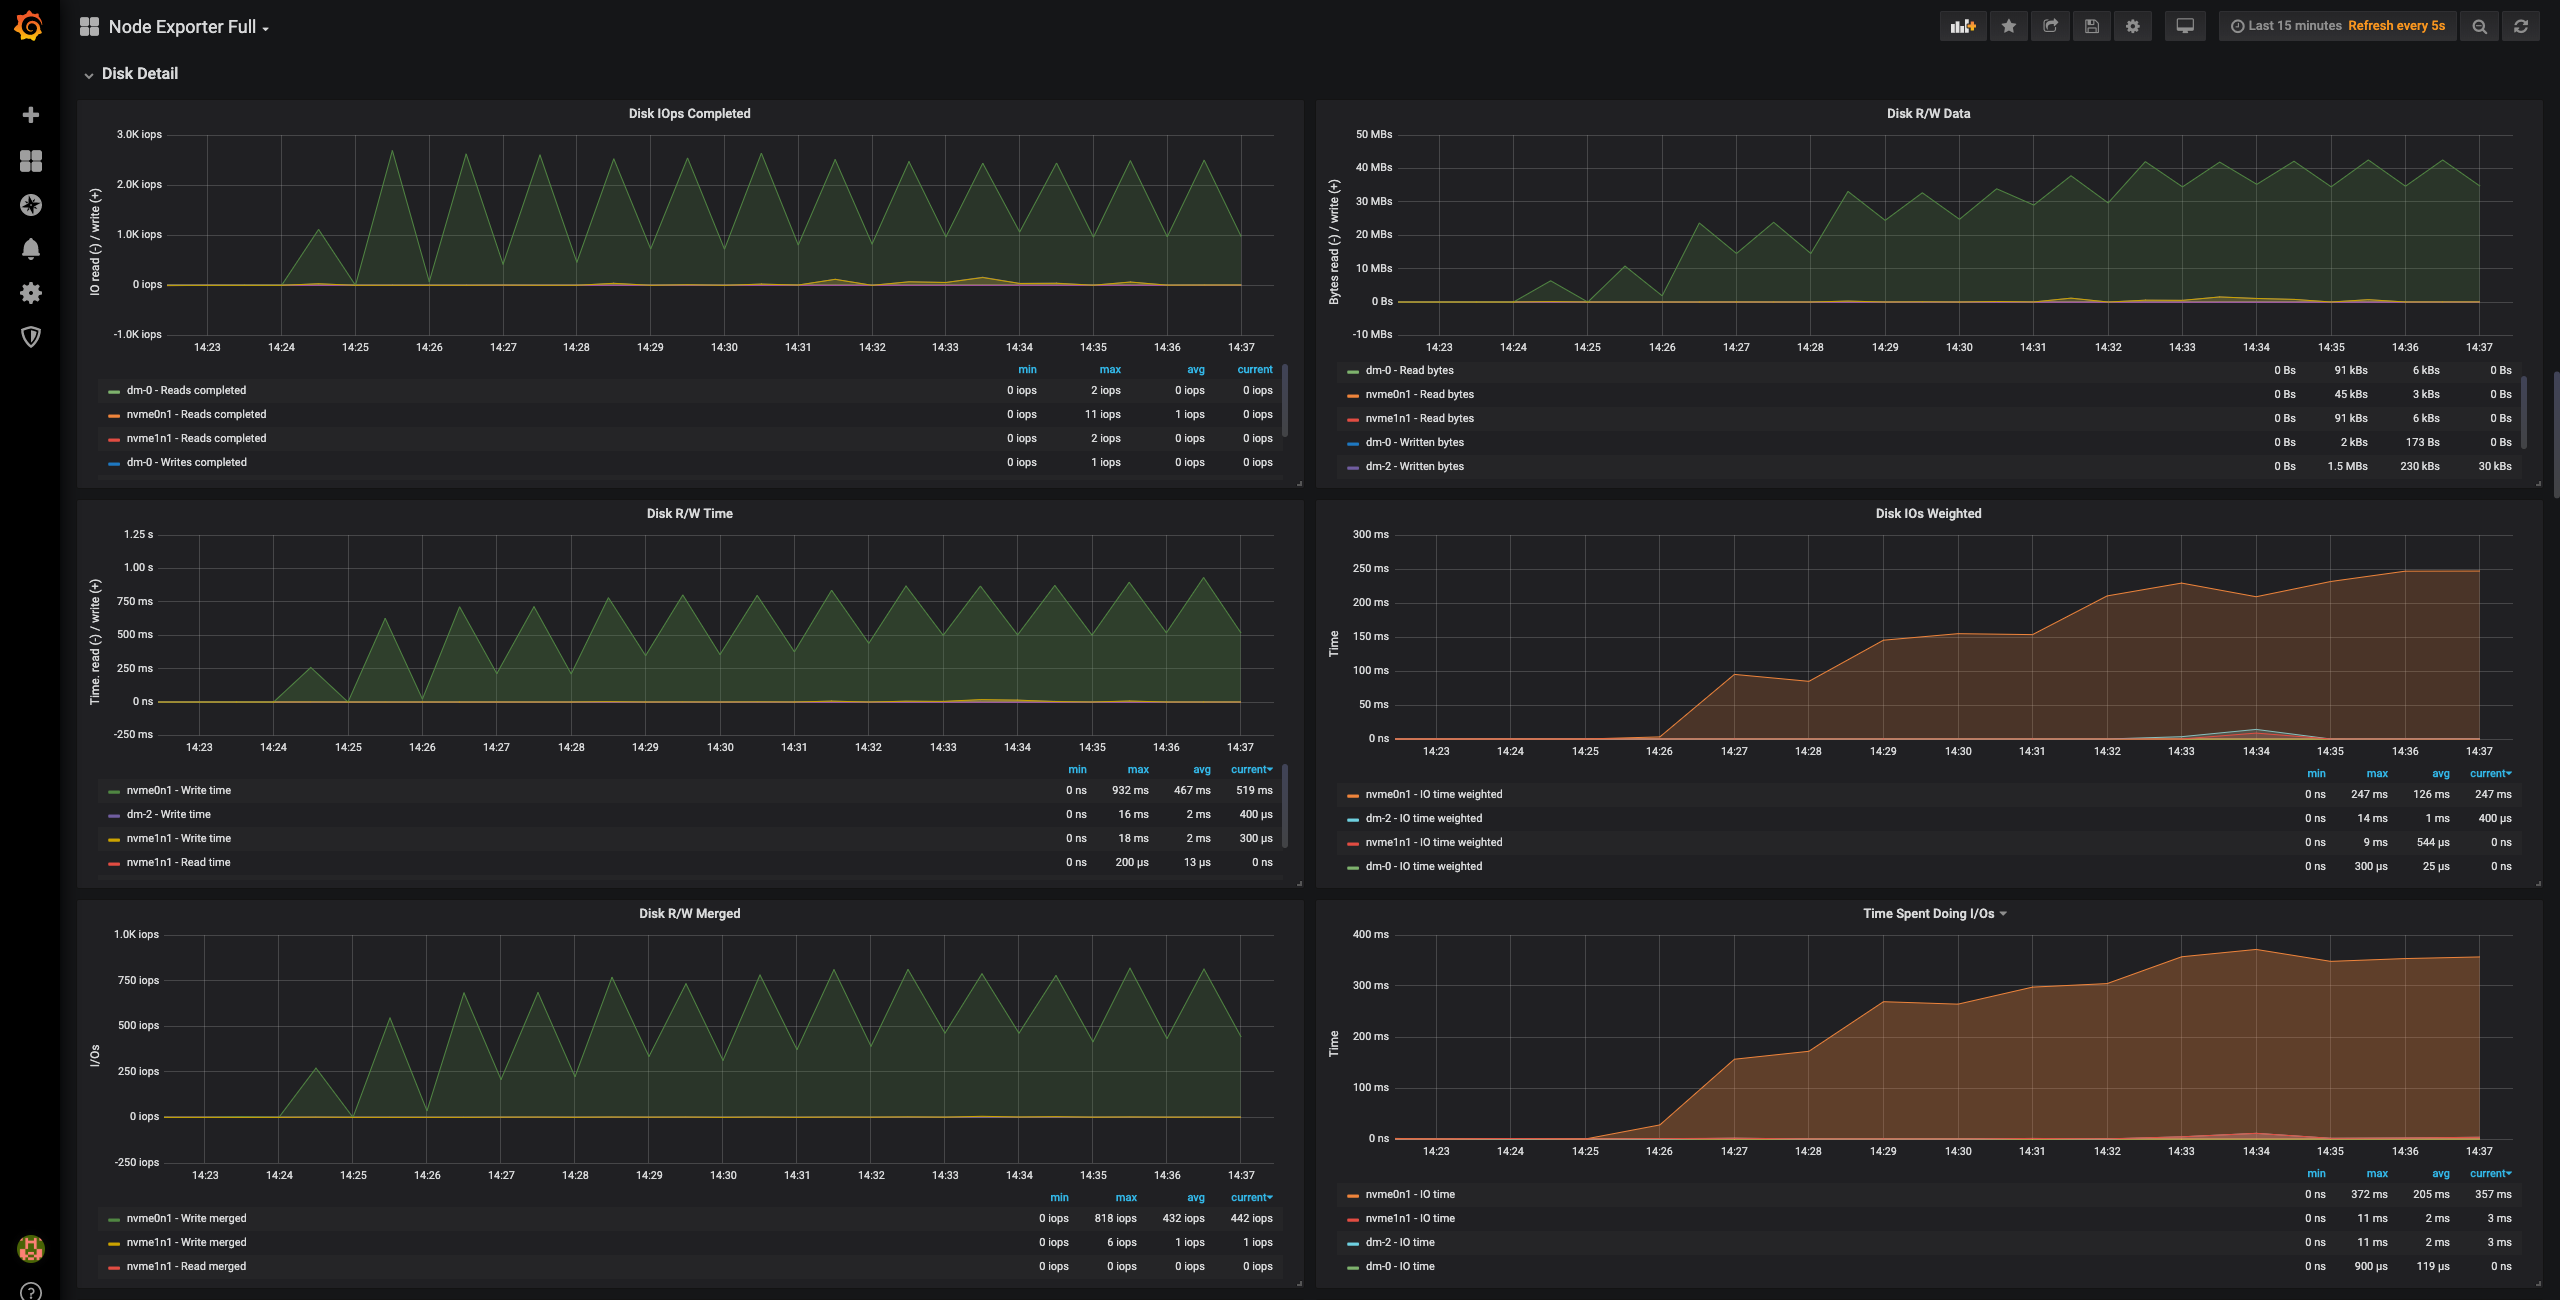
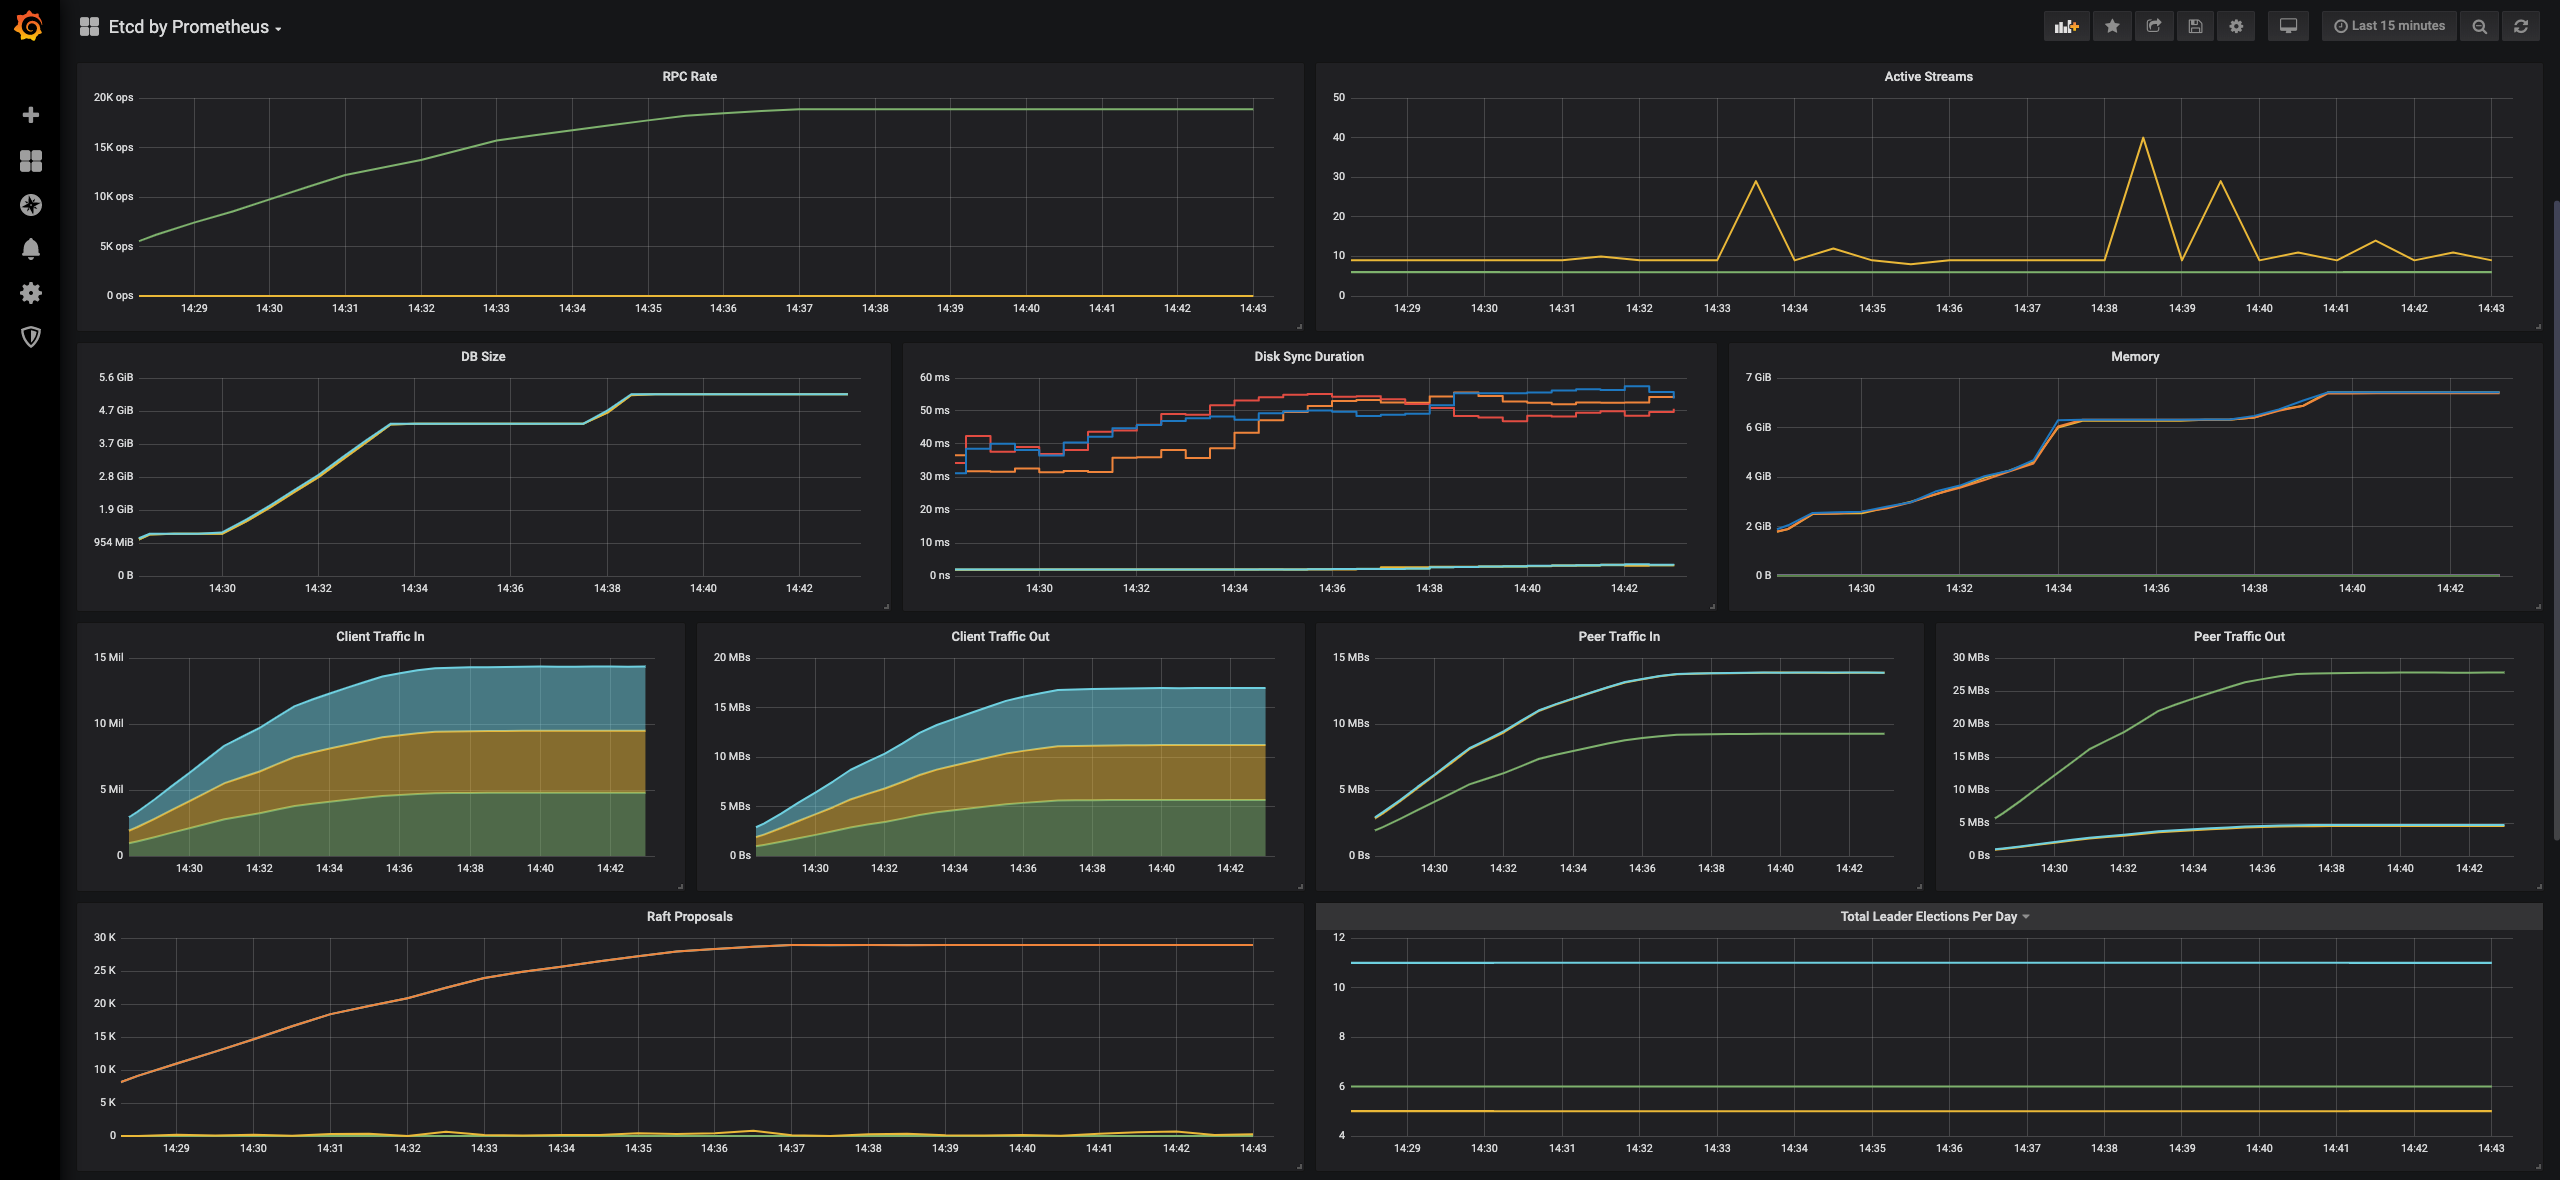
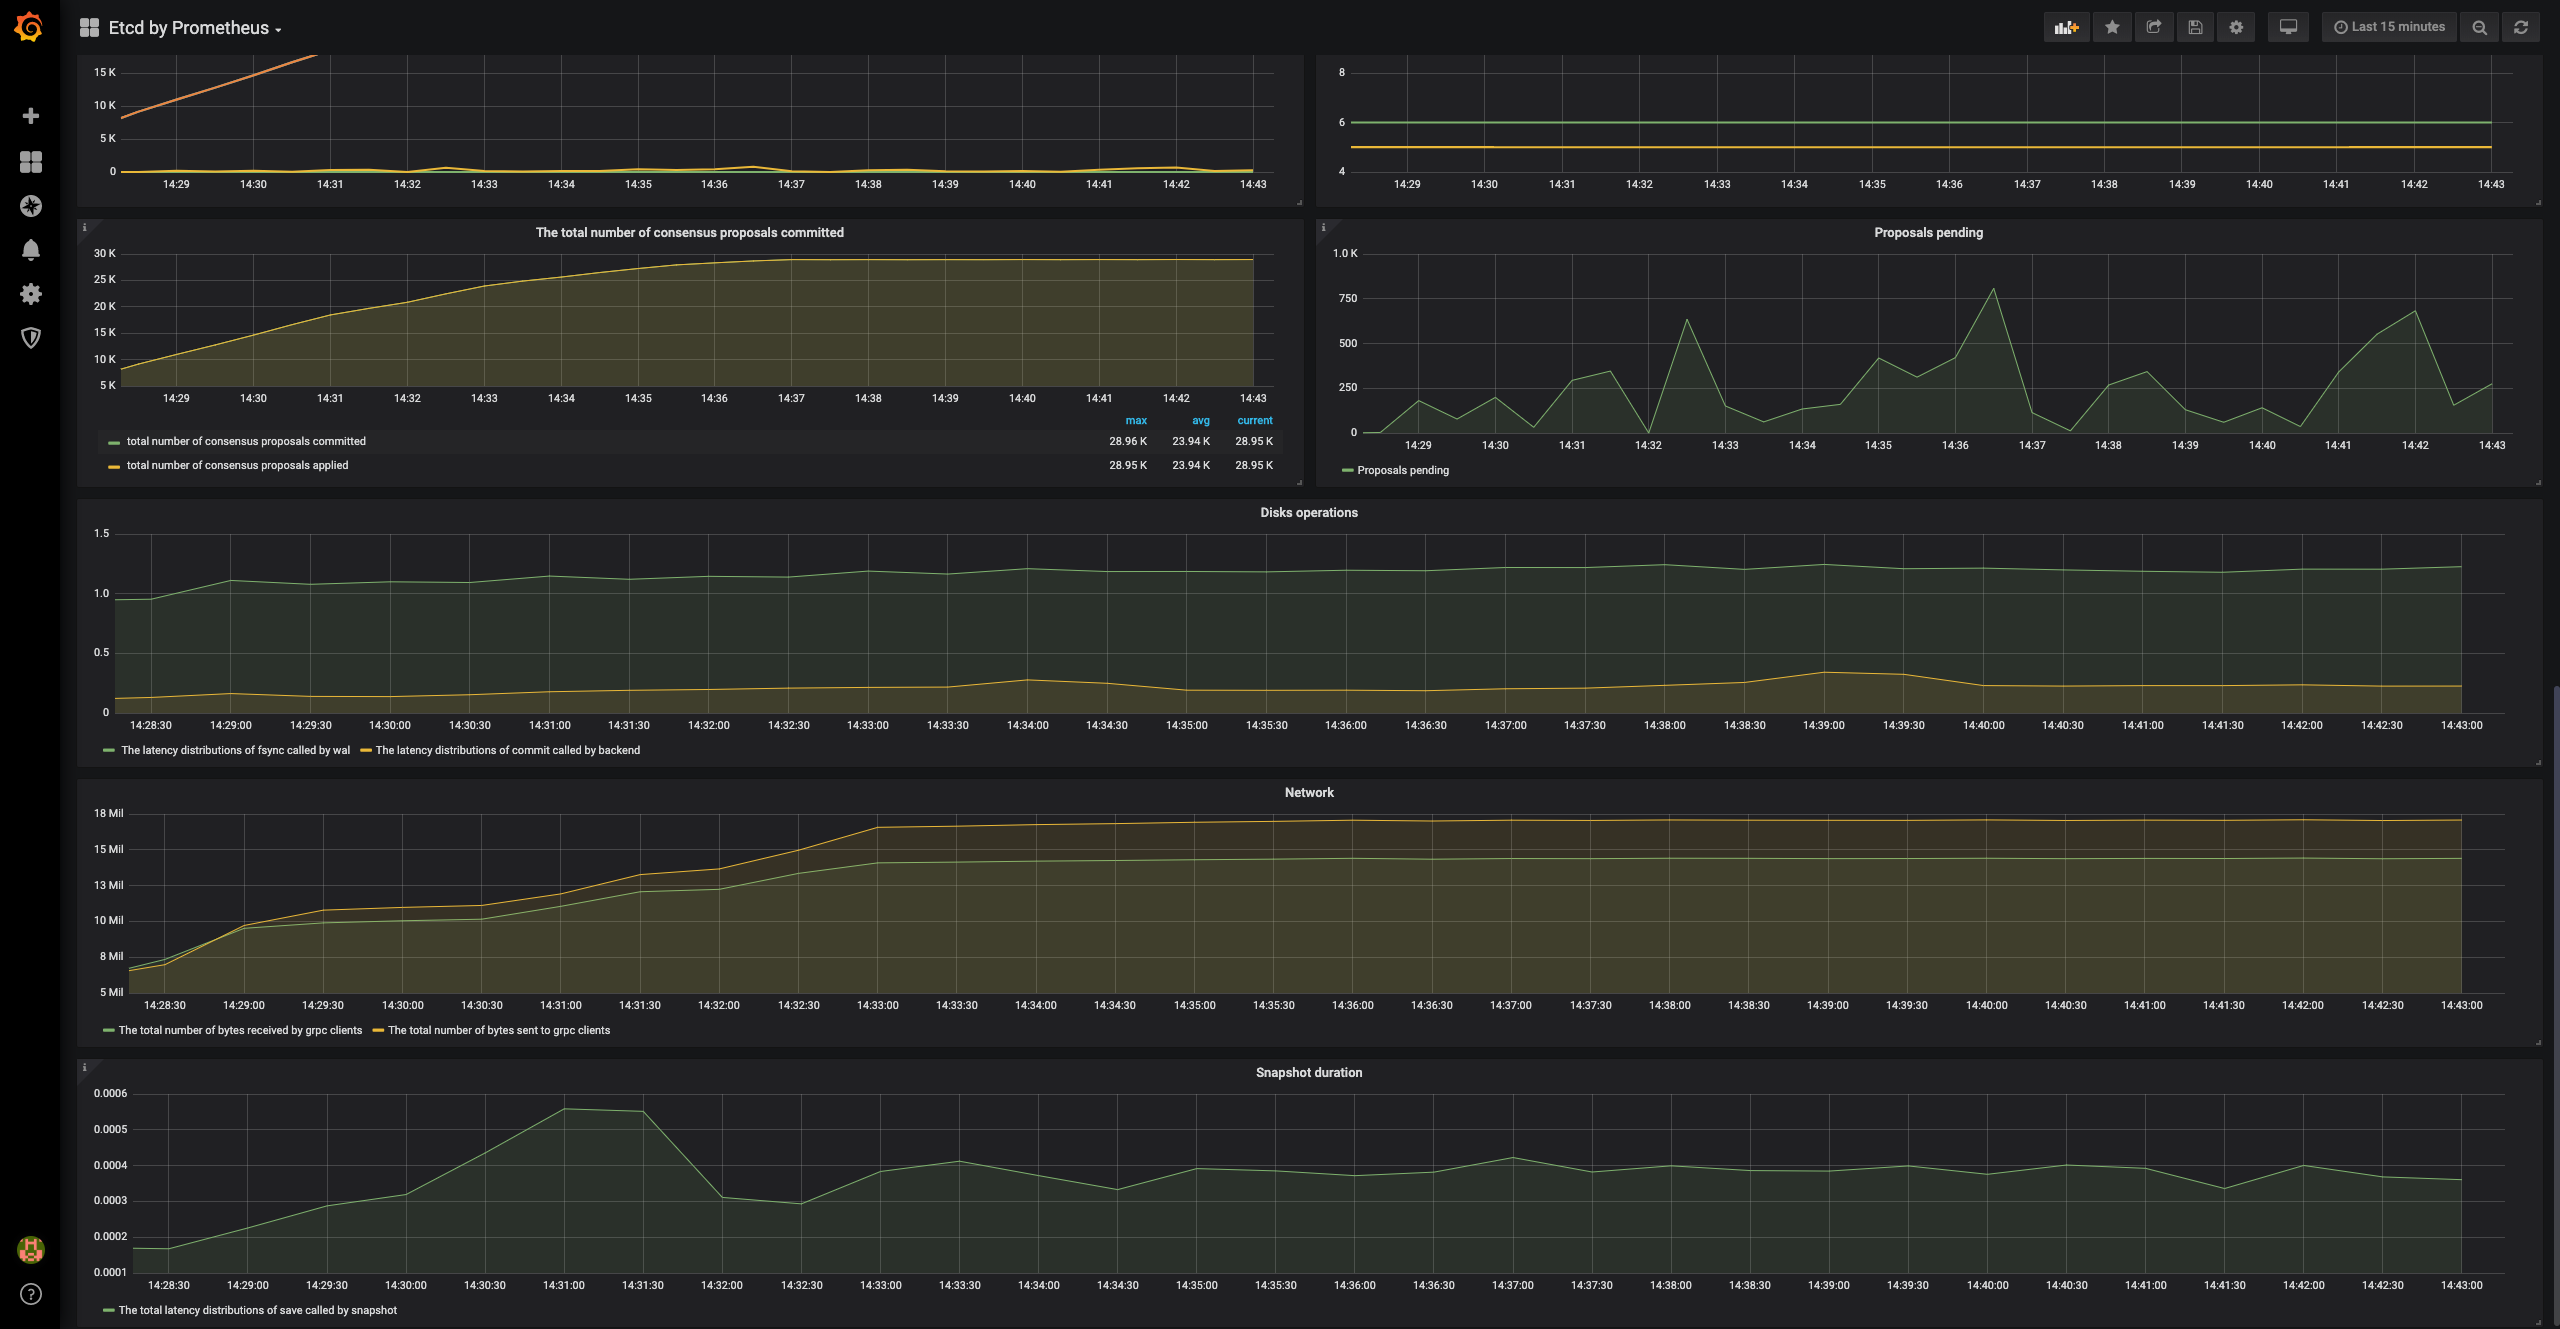
Use Grafana to observe system performance. Grafana runs on port 3000 of the SSH jump host. Watch service logs for any red flags (e.g. increased etcd range request times). Do not forget to collect profiles when you observe anomalous behaviour! Use Grafana to compare the test results with previous test runs by comparing with the images listed here, and the last run posted in the Release Checklist.
** Allow the tests to run for an hour or so before continuing. **
Perform the same instructions as testing Postgres, without configuring
postgres.yml. The agent loadit scripts and test checks live in
sensu-perf/tests/3-backends-14k-agents-4-subs/.
Shutdown the Testbed from the SSH jump host:
./shutdown.sh
- Open the Google Drive Folder for Performance Testing
- Update the summary Google Sheet document with the results (for both Postgres & etcd) with the maximum number of total processed events per second, during which Sensu was stable
- Create a new folder for the release and upload screenshots (for both Postgres & etcd)
- Take a snapshot of the Grafana dashboard and save it under the same name as the Google Drive folder.
Using the 3-backends-20k-agents-4-subs-pg assets and configuration, the Sensu Testbed was able to comfortably handle 40,000 Sensu Agent connections (and their keepalives) and process over 36,000 events per second. The testbed could process over 40,000 events per second, however, the cluster would periodically throttle Agent check executions with back pressure.
Using the 3-backends-6k-agents-3-subs assets and configuration, the Sensu Testbed was able to comfortably handle 12,000 Sensu Agent connections (and their keepalives) and process over 8,500 events per second.
