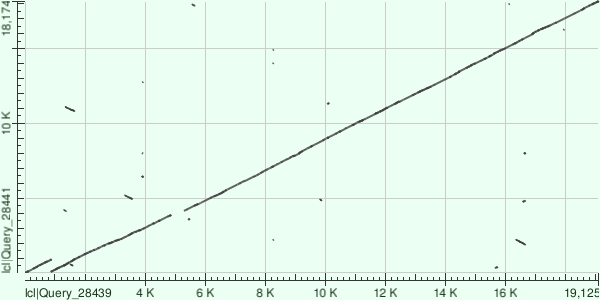
The online BLAST (https://blast.ncbi.nlm.nih.gov) makes dot plots which look like this:
Unfortunately, the standalone BLAST lacks the capability of making dot plots. I have made a tool named Dot_plot_like_in_BLAST specifically for this purpose. Basically, it is a standalone tool that aligns by BLAST two nucleotide sequences and makes a dot plot. The main differences from the online BLAST are:
- While the online BLAST always makes rectangular images with a 2:1 aspect ratio, the aspect ratio in Dot_plot_like_in_BLAST is equal to the ratio of sequences' lengths. In other words, Dot_plot_like_in_BLAST doesn't distort lengths.
- The online BLAST draws direct and reverse matches in one color. Dot_plot_like_in_BLAST draws direct matches in blue, and reverse matches in orange.
- Dot_plot_like_in_BLAST has several options for image customization. For example, it allows to change the font size and line width.
- The online BLAST make images in PNG. Dot_plot_like_in_BLAST makes images in PNG, SVG, and also it makes interactive files in HTML. In the interactive file you can magnify a region of interest and save an SVG file specifically for this region.
This is how an image made by Dot_plot_like_in_BLAST looks. It was made for the same sequences as the image above.


Dot_plot_like_in_BLAST has two prerequisites:
- The path to BLAST+ executable files should be in $PATH . BLAST+ can be downloaded here https://ftp.ncbi.nlm.nih.gov/blast/executables/blast+/LATEST/
- The Python library Plotly should be installed. You can install it, for example, using the following command:
pip3 install --upgrade --user plotly
Then, download the latest version of Dot_plot_like_in_BLAST from Releases and extract the archive. That's all.
Dot_plot_like_in_BLAST works on all operating systems.
Dot_plot_like_in_BLAST has only two mandatory options:
- --file_with_the_first_sequence . This is the path to a FASTA file with the first sequence.
- --file_with_the_second_sequence . This is the path to a FASTA file with the second sequence.
A typical command of Dot_plot_like_in_BLAST looks like this:
python3 dot_plot_like_in_BLAST.py --file_with_the_first_sequence sequence_1.fasta --file_with_the_second_sequence sequence_2.fasta
Dot_plot_like_in_BLAST creates a folder with results. The three main files in this folder are: image.png, image.svg, image.html. They are, respectively, a raster image with the dot plot, a vector image with the dot plot, and an interactive image with the dot plot.
Dot_plot_like_in_BLAST has many options that allow you to customize alignment and visualization. For example:
- --minimum_percent_identity . Sets the minimum percent identity for a match.
- --minimum_match_length . Sets the minimum match length.
- --font_size . Sets the font size in the image.
And many others. To see the full list of options, runpython3 dot_plot_like_in_BLAST.py --help
- Where can I suggest features and report problems?
To suggest features and report problems, please post in Issues (https://github.com/shelkmike/Dot_plot_like_in_BLAST/issues). - Can Dot_plot_like_in_BLAST be used for very long sequences, like entire eukaryotic chromosomes?
Yes, but the calculation can take a lot of time if you use the default parameters. You may need to increase --minimum_percent_identity and --minimum_match_length; decrease --number_of_best_matches_to_draw; set --blast_tool_to_use to "megablast".
For example, with the following settings the calculation will be faster than with default settings: "--minimum_percent_identity 80 --minimum_match_length 1000 --blast_tool_to_use megablast". - How does Dot_plot_like_in_BLAST depict indels?
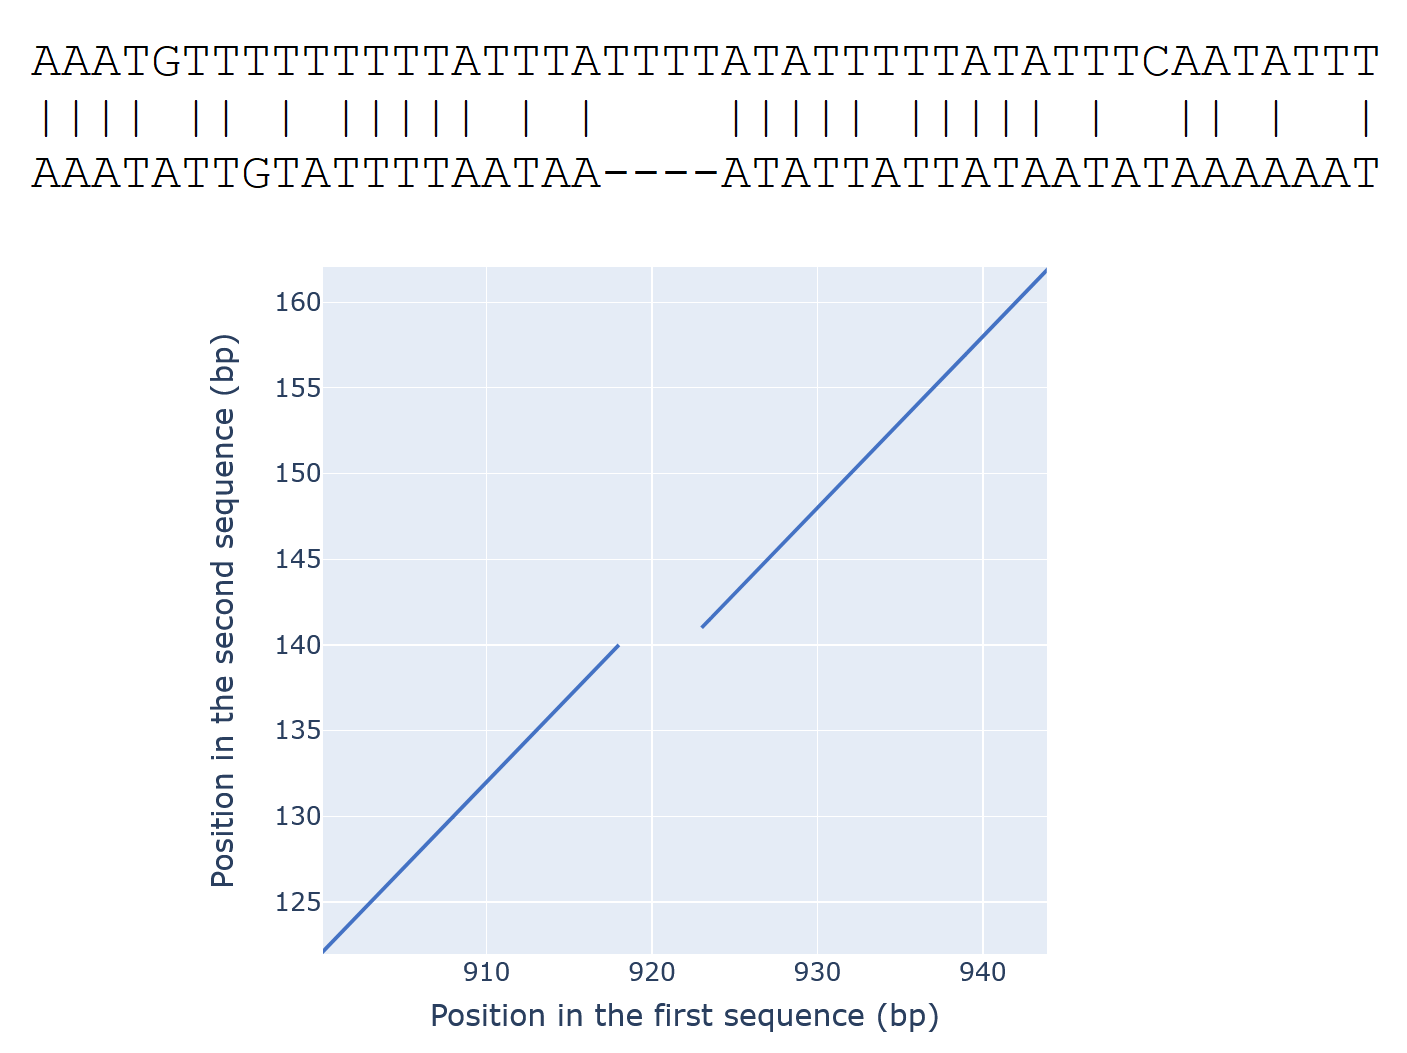
Just as in the online BLAST, indels (gaps in the alignment) are depicted by gaps in the diagram.
For example, here is an alignment (a part of a much longer alignment) and a corresponding diagram: