probes falling back to proc parsing due to late eBPF events #2650
Comments
|
@alban has suggested offline:
|
|
Could this be due to iovisor/gobpf#42 ? |
|
@rade How many cpus do you have on the machine where the bug was produced? I am currently trying to reproduce this on GCE with this config: |
|
|
FYI, on our dev cluster of seven machines, all the probes were started on 2017/06/29 21:51. Four of them are still running in ebpf mode now, the other three encountered a timestamp discrepancy at
respectively. So this error does appear to be quite rare. |
|
I can reproduce the bug using (I added more vCPUs) I start nginx with I open several terminals and run |
|
great! should be easy to fix then ;) |
|
I cannot reproduce this on my laptop but only on GCE with the configuration above. Trying to see what the difference could be, I notice that GCE has a clock skew daemon but disabling it didn't help. I wrote a program (bpf_clocks) to compare the kernel clock Next thing to check is if the clock is consistent between cpus or if one cpu can have a different clock than another. I suspect each cpu can give different results because of two comments I read:
I am not sure how to write a test to check if it is the cause of the problem. But that's what I would like to check next. |
|
@alban do you want me to give you access to one of our clusters where the problem occurs? |
|
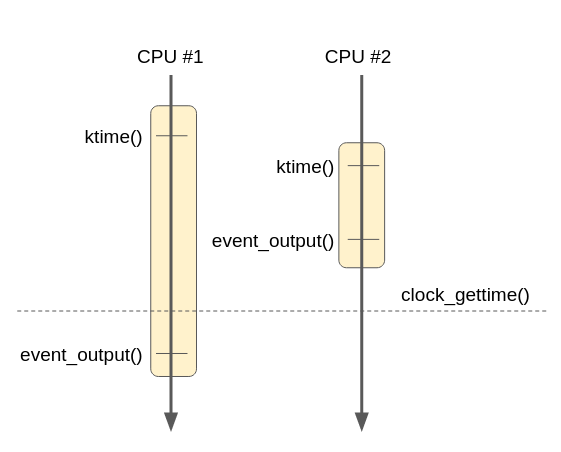
@rade no need for now because I can reproduce the bug without. Status update: still exploring... I continued with my bpf_clocks program to compare the kernel and userspace clocks and looked at more instances and I didn't notice discrepancies between the clocks. I wrote another program to look at the clocks between cpus based on https://github.com/karthick18/ticket_spinlock (with this patch) and I also didn't notice discrepancies. I am exploring a different possible race: the execution of one eBPF function (such as With virtual CPUs on platforms like GCE and AWS, there is no guarantees that a CPU is not suspended by the hypervisor, so different execution of eBPF functions can take variable amount of time. We could have the following scenario:
In order to check if this scenario really happens, I added a new type of event (named type |
|
When looking at the timestamps in the logs, I was not able to observe the race described in my comment above so not sure if it is a correct explanation. I gave Ubuntu 16.10 with Linux 4.8.0-59-generic a try and the bug is still reproducible there. So it does not seem due to an old kernel. |
|
I didn't reach a conclusion on the root cause so I will go on with the workaround:
|
|
That's quite a big hack but I don't have a better suggestion ... |
EbpfTracker can die when the tcp events are received out of order. This
can happen with a buggy kernel or apparently in other cases, see:
weaveworks#2650

As a workaround, restart EbpfTracker when an event is received out of
order. This does not seem to happen often, but as a precaution,
EbpfTracker will not restart if the last failure is less than 5 minutes
ago.

This is not easy to test but I added instrumentation to trigger a
restart:

- Start Scope with:
    $ sudo WEAVESCOPE_DOCKER_ARGS="-e SCOPE_DEBUG_BPF=1" ./scope launch

- Request a stop with:
    $ echo stop | sudo tee /proc/$(pidof scope-probe)/root/var/run/scope/debug-bpf
We see this:
after running probes for hours, even days.
The message is produced by the logic introduced in #2334, even though we are running Ubuntu with a 4.4.0-81 kernel, which should not exhibit the problem described in that issue.
@alban any idea how we might go about tracking this down?
Also, as a workaround, is there any downside to simply restarting all the eBPF tracking when getting this error, i.e. going through the same initialisation as when initially starting the probes, including the initial proc walk? We'd need to guard against "flapping", obviously.
The text was updated successfully, but these errors were encountered: