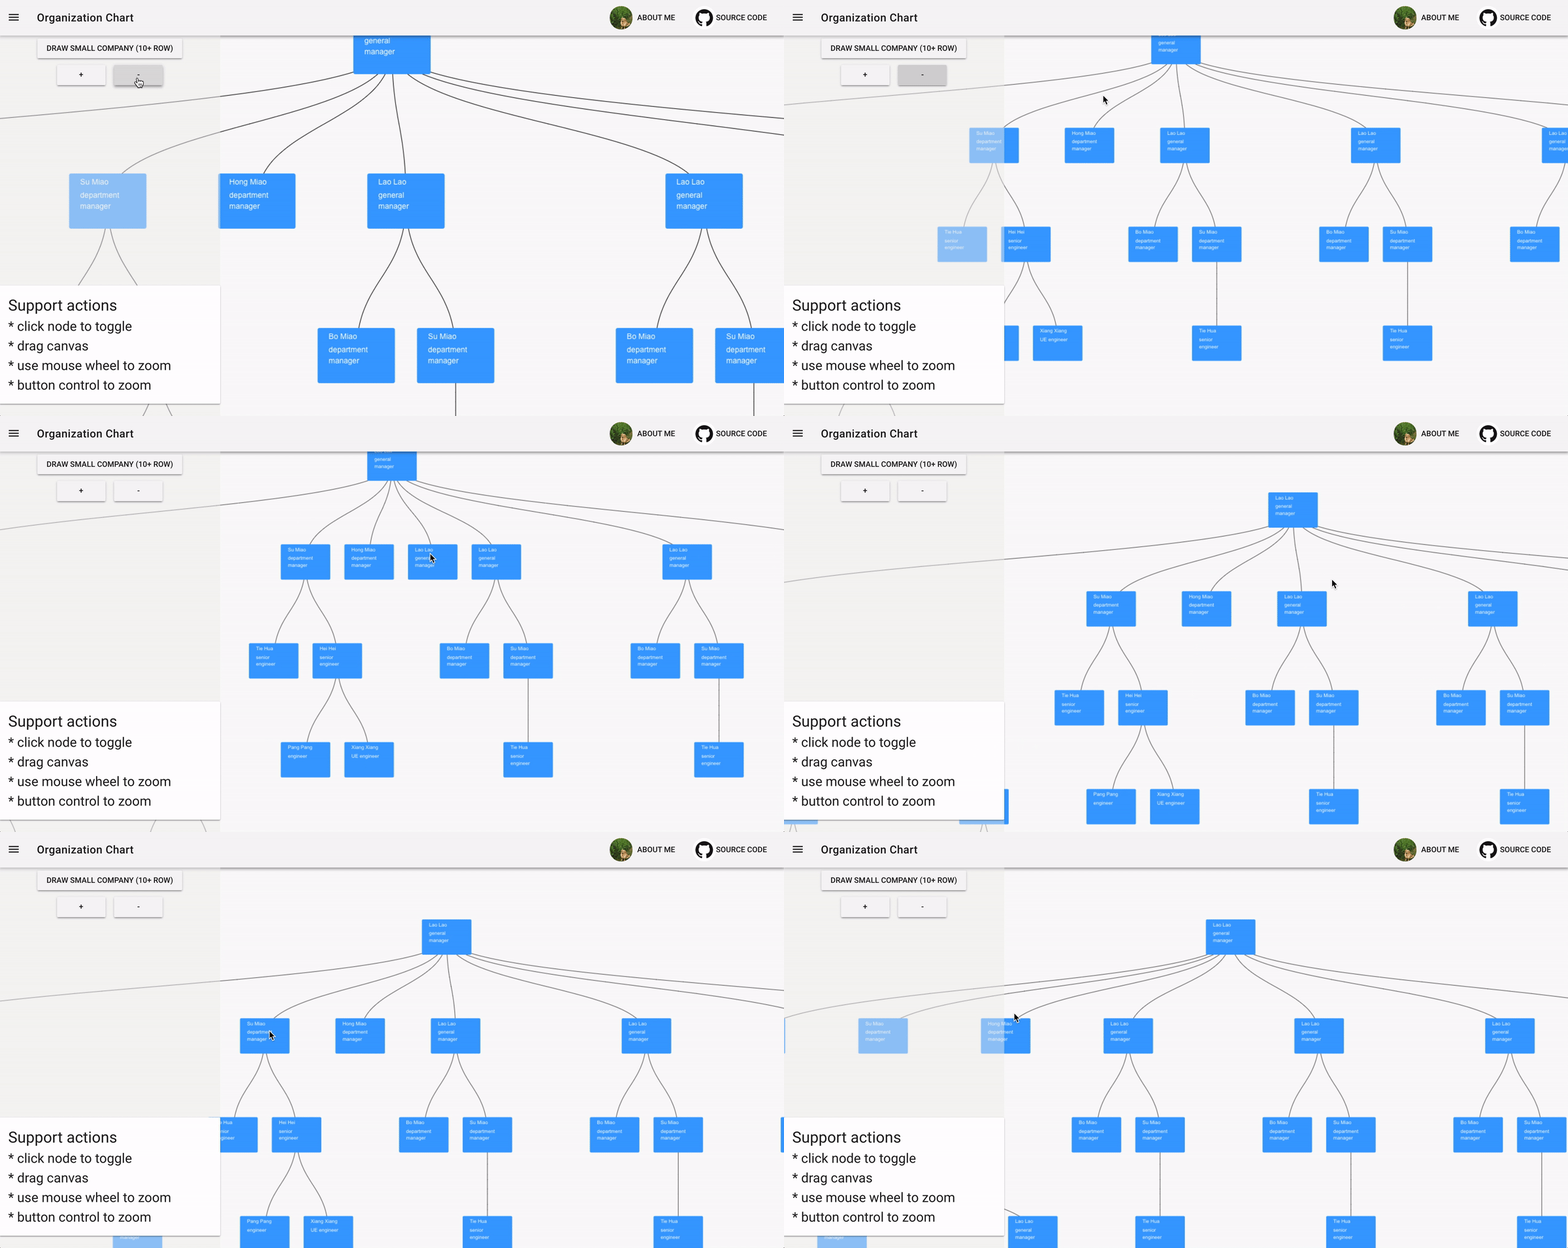
https://ssthouse.github.io/vue-tree-chart/#/svgTree
- use D3.js with Canvas to draw organizationChart more efficiently.
- Use
unique-colormanner to identify mouse click event in Canvas (you can refer to https://medium.com/@lverspohl/how-to-turn-d3-and-canvas-into-good-friends-b7a240a32915 to see detail)
- use D3 to calculate node & link positon
- use Vue to handle dom element entring and leaving
- use Vue slot to let user easily use with their own data
npm install @ssthouse/vue-tree-chartimport VueTree from '@ssthouse/vue-tree-chart'
import Vue from 'vue'
Vue.component('vue-tree', VueTree)3.1 basic usage
See Code
<template>
  <div class="container">
    <vue-tree
      style="width: 800px; height: 600px; border: 1px solid gray;"
      :dataset="sampleData"
      :config="treeConfig"
    >
    </vue-tree>
  </div>
</template>

<script>
export default {
  name: 'treemap',
  data() {
    return {
      sampleData: {
        value: '1',
        children: [
          { value: '2', children: [{ value: '4' }, { value: '5' }] },
          { value: '3' }
        ]
      },
      treeConfig: { nodeWidth: 120, nodeHeight: 80, levelHeight: 200 }
    }
  }
}
</script>

<style scoped lang="less">
.container {
  display: flex;
  flex-direction: column;
  align-items: center;
}
</style>
3.2 show collapsed node in different style
See Code
<template>
  <div class="container">
    <vue-tree
      style="width: 800px; height: 600px; border: 1px solid gray;"
      :dataset="sampleData"
      :config="treeConfig"
    >
      <template v-slot:node="{ node, collapsed }">
        <span
          class="tree-node"
          :style="{ border: collapsed ? '2px solid grey' : '' }"
          >{{ node.value }}</span
        >
      </template>
    </vue-tree>
  </div>
</template>

<script>
export default {
  name: 'treemap',
  data() {
    return {
      sampleData: {
        value: '1',
        children: [
          { value: '2', children: [{ value: '4' }, { value: '5' }] },
          { value: '3' }
        ]
      },
      treeConfig: { nodeWidth: 120, nodeHeight: 80, levelHeight: 200 }
    }
  }
}
</script>

<style scoped lang="less">
.container {
  display: flex;
  flex-direction: column;
  align-items: center;
}

.tree-node {
  display: inline-block;
  width: 28px;
  height: 28px;
  border-radius: 50%;
  background-color: antiquewhite;
  text-align: center;
  line-height: 28px;
}
</style>
3.3 render rich media data
See Code
<template>
  <div class="container">
    <vue-tree
      style="width: 1000px; height: 600px; border: 1px solid gray;"
      :dataset="richMediaData"
      :config="treeConfig"
    >
      <template v-slot:node="{ node, collapsed }">
        <div
          class="rich-media-node"
          :style="{ border: collapsed ? '2px solid grey' : '' }"
        >
          <img
            :src="node.avatar"
            style="width: 48px; height: 48px; border-raduis: 4px;"
          />
          <span style="padding: 4px 0; font-weight: bold;"
            >能力值{{ node.value }}</span
          >
        </div>
      </template>
    </vue-tree>
  </div>
</template>

<script>
export default {
  name: 'treemap',
  data() {
    return {
      richMediaData: {
        name: 'James',
        value: 800,
        avatar:
          'https://gravatar.com/avatar/db51fdaf64d942180b5200ca37d155a4?s=400&d=robohash&r=x',
        children: [
          {
            name: 'Bob',
            value: 400,
            avatar:
              'https://gravatar.com/avatar/16b3b886b837257757c5961513396a06?s=400&d=robohash&r=x',
            children: [
              {
                name: 'C1',
                value: 100,
                avatar:
                  'https://gravatar.com/avatar/4ee8775f23f12755db978cccdc1356d9?s=400&d=robohash&r=x'
              },
              {
                name: 'C2',
                value: 300,
                avatar:
                  'https://gravatar.com/avatar/d3efa8fa639bdada96a7d0b4372e0a96?s=400&d=robohash&r=x'
              },
              {
                name: 'C3',
                value: 200,
                avatar:
                  'https://gravatar.com/avatar/4905bc3e5dc51a61e3b490ccf1891107?s=400&d=robohash&r=x'
              }
            ]
          },
          {
            name: 'Smith',
            value: 200,
            avatar:
              'https://gravatar.com/avatar/d05d081dbbb513180025300b715d5656?s=400&d=robohash&r=x',
            children: [
              {
                name: 'S1',
                value: 230,
                avatar:
                  'https://gravatar.com/avatar/60c1e69e690d943c5dc06568148debc4?s=400&d=robohash&r=x'
              }
            ]
          },
          {
            name: 'Jackson',
            value: 300,
            avatar:
              'https://gravatar.com/avatar/581f7a711c815d9671c35ebd815ec1e4?s=400&d=robohash&r=x'
          }
        ]
      },
      treeConfig: { nodeWidth: 120, nodeHeight: 80, levelHeight: 200 }
    }
  }
}
</script>

<style scoped lang="less">
.container {
  display: flex;
  flex-direction: column;
  align-items: center;
}

.rich-media-node {
  width: 80px;
  padding: 8px;
  display: flex;
  flex-direction: column;
  align-items: flex-start;
  justify-content: center;
  color: white;
  background-color: #f7c616;
  border-radius: 4px;
}
</style>
3.4 render tree with multiple parents
See Code
<template>
  <div class='container'>
    <vue-tree
      style="width: 800px; height: 600px; border: 1px solid gray;"
      :dataset="vehicules"
      :config="treeConfig"
      linkStyle="straight"
    >
      <template v-slot:node="{ node, collapsed }">
        <div
          class="rich-media-node"
          :style="{ border: collapsed ? '2px solid grey' : '' }"
        >
          <span style="padding: 4px 0; font-weight: bold;"
          >能力值{{ node.name }}</span
          >
        </div>
      </template>
    </vue-tree>
  </div>
</template>
<script>
export default {
  name: 'treemap',
  data() {
    return {
      vehicules: {
        name: 'Wheels',
        children: [
          {
            name: 'Wings',
            children: [
              {
                name: 'Plane'
              }
            ]
          },
          {
            name: 'Piston',
            customID: 3
          },
          {
            name: 'Carburetor',
            children: [
              {
                name: 'Truck',
                customID: 2
              },
              {
                name: 'Car',
                customID: 2
              }
            ]
          },
          {
            name: 'Valve',
            customID: 4
          },
          {
            name: 'Crankshaft',
            customID: 1
          }
        ],
        links: [
          { parent: 1, child: 2 },
          { parent: 3, child: 2 },
          { parent: 4, child: 2 }
        ],
        identifier: 'customID'
      },
      treeConfig: { nodeWidth: 120, nodeHeight: 80, levelHeight: 200 }
    }
  }
}
</script>

<style scoped lang="less">
.container {
  display: flex;
  flex-direction: column;
  align-items: center;
}

.rich-media-node {
  width: 80px;
  padding: 8px;
  display: flex;
  flex-direction: column;
  align-items: flex-start;
  justify-content: center;
  color: white;
  background-color: #f7c616;
  border-radius: 4px;
}
</style>4.1 props
| type | default | description | |
|---|---|---|---|
| dataset | Object | null | nested tree data |
| config | Object | { nodeWidth: 100, nodeHeight: 100, levelHeight: 200 } |
nodeWidth and nodeHeight config the tree node size. levelHeight is tree row height |
| linkStyle | String | 'curve' | control link style, options: 'curve' or 'straight' |
| direction | string | 'vertical' | control tree chart direction, options: 'vertical' or 'horizontal' |
| collapse-enabled | Boolean | true | Control whether when clicking on a node it collapses its children |
4.2 slot
this component only support default slot.
a sample usage like this:
<template v-slot:node="{ node, collapsed }">
  <span
    class="tree-node"
    :style="{ border: collapsed ? '2px solid grey' : '' }"
    >{{ node.value }}</span
  >
</template>
there are two slot params provided to render slot content:
| slot param | type | description |
|---|---|---|
| node | Object | current node data to be rendered |
| collapsed | Boolean | current node collapse status |
4.3 API > zoom
use vue ref to call zoom api.
support methods:
zoom in: this.$refs.tree.zoomIn()
zoom out: this.$refs.tree.zoomOut()
restore initial scale: this.$refs.tree.restoreScale()
the canvas version is not published with npm module.
if you want to use this project's canvas version, please download the source code and edit with the following steps:
- replace the data in
/src/base/data-generator.jswith your own nested data. - add your data drawing logic in
/src/components/org-chart.js #drawShowCanvas
# install dependencies
npm install

# serve with hot reload at localhost
npm run dev

# build for production with minification (build to ./docs folder, which can be auto servered by github page 🤓)
npm run build


