-
Notifications
You must be signed in to change notification settings - Fork 49
Home
AppDynamics provides a rich source of information about your monitored applications, including the performance of individual business activities, dependency flow between application components, and details on every business transaction in an instrumented environment. We provide a rich toolkit for turning the vast corpus of data captured by AppDynamics into valuable insights.
AppDynamics DEXTER (Data Extraction and Enhanced Reporting) can make this process even faster and simpler. DEXTER provides new ways to unlock the data stored in the AppDynamics platform. You can analyze this information in a number of data warehousing and visualization applications, and combine it with your own data to generate customized reports.
- Root Cause Analysis with Visual Tools that uses DEXTER-extracted data https://www.linkedin.com/pulse/slow-app-root-cause-analysis-visual-analytics-tools-daniel-odievich/
- Too Much Telemetry? Analyzing Large Volume of Application Performance Data with Snowflake and Tableau https://www.linkedin.com/pulse/too-much-telemetry-analyzing-large-volume-application-daniel-odievich/
You can see the reports from our demo environments here.
If you use DEXTER and want to provide feedback, please complete this questionnaire.
| Link | More Links |
|---|---|
| Schema | Data Warehouse Schema |
| Walkthrough | Concepts behind this tool |
| Get Started |
Install Application Credentials Job File Run Application (Windows, Mac, Linux) Proxy Advanced |
| Output Folder Structure | Understand where the results are |
| Excel Reports | List of Reports |
| PowerBI Reports |
Apply Templates Adjust Locale List of Reports |
| Tableau Reports |
Apply Templates Adjust Locale List of Reports |
| Browser Reports | Flame Graph and Entity Dashboards Reports |
AppDynamics DEXTER produces this schema:
The schema picture is also available as Visio from Releases.
This 3 part walkthrough provides introduction into features and capabilities of AppDynamics DEXTER.
| Report | Image | Purpose |
|---|---|---|
| Entities, Metrics and Snapshots Visualizations |  |
In Walkthrough Part 1, we discover how Metrics, Events and Snapshots extracted from the AppDynamics Platform become available for offline data mining and archival use |
| Data Mining Snapshots |  |
In Walkthrough Part 2, we dig deep into application performance analysis with Snapshot data using data mining and visual data analysis tools. |
| Advanced Snapshot and Exit Call Exploration |  |
In Walkthrough Part 3, we look at the more advanced reports that allow you to focus on your application performance and application configuration utilizing Flame Graphs, Sankey flow diagrams and visual data analysis tools |
Download latest release from Releases section, (AppDynamics.DEXTER.#.#.#.#.zip)
Unzip to some location, for example, C:\AppDynamics\DEXTER or /home/yourusername/DEXTER.
You will need AppDynamics Internal account to use with DEXTER.
Only AppDynamics authentication is supported. LDAP or SAML credentials can not be used.
The account must have at least READ-level access to the APM Applications and other components that you need.
For Configuration, Controller Settings and User RBAC inventory reports, you will need Account Owner higher-level permissions to retrieve that data.
If the user you choose does not have required rights, AppDynamics DEXTER will simply not render those reports but should continue to run.
Specify data to operate on with Job File. Review some of the Job File Examples.
The template job file is called DefaultJob.json. Make a copy of it and modify according to your needs using your favorite text editor.
Alternatively, create the Job File using DEXTER-UI visual tool.
You can also watch this training video:
DEXTER can run on Windows, Mac or Linux.
It uses .NET Framework and can run using either .NET Full Framework 4.7.2 or .NET Core Framework 3.1.
When running on Windows, you can choose to run version built using either .NET Full or .NET Core frameworks.
For .NET Full framework version (full-win) or .NET Core portable version (core-win-portable), make sure those frameworks are installed on your OS.
For .NET Core self-contained version (core-win), no additional installations are necessary because .NET Core runtime is included with application.
| Framework | Folder | Command |
|---|---|---|
| .NET Full 4.7.2 Install |
full-win | full-win\AppDynamics.Dexter.exe --job-file MyJob.json |
| .NET Core 3.1 Install, Prerequisites |
core | dotnet core-win-portable\AppDynamics.Dexter.dll --job-file MyJob.json |
| .NET Core 3.1 self-contained | core-win | core-win\AppDynamics.Dexter.exe --job-file MyJob.json |
When running on Mac, you can choose between version using already installed .NET Core framework or the self-contained option.
For .NET Core portable version (core-osx-portable), make sure .NET Core Framework is installed on your OS.
For .NET Core self-contained version (core-osx), no additional installations are necessary because .NET Core runtime is included with application.
| Framework | Folder | Command |
|---|---|---|
| .NET Core 3.1 Install, Prerequisites |
core | dotnet core-osx-portable/AppDynamics.Dexter.dll --job-file MyJob.json |
| .NET Core 3.1 self-contained | core-osx | core-osx/AppDynamics.Dexter --job-file MyJob.json |
NOTE: If you are running on Mac Catalina, the Gatekeeper application will complain that DEXTER DLLs come from untrusted source while executing the application.
To counteract it, remove "com.apple.quarantine" attribute from the downloaded ZIP file before extracting it by running the following command:
xattr -d com.apple.quarantine AppDynamics.DEXTER*.zip
After extracting the binaries, you must mark AppDynamics.Dexter as executable by running the following command:
chmod 755 AppDynamics.Dexter
When running on Linux, you can choose between version using already installed .NET Core framework or the self-contained option.
For .NET Core portable version (core-linux-portable), make sure .NET Core Framework is installed on your OS.
For .NET Core self-contained version (core-linux), no additional installations are necessary because .NET Core runtime is included with application.
| Framework | Folder | Command |
|---|---|---|
| .NET Core 3.1 Install, Prerequisites |
core | dotnet core-linux-portable/AppDynamics.Dexter.dll --job-file MyJob.json |
| .NET Core 3.1 self-contained | core-linux | core-linux/AppDynamics.Dexter --job-file MyJob.json |
After extracting the binaries, you must mark AppDynamics.Dexter as executable:
chmod 755 AppDynamics.Dexter
If you are behind corporate proxy, configure Proxy Settings.
Understand which metrics are extracted by default and add your own Metric Sets to extract more.
Review all available Command Line Parameters.
Understand execution sequence in Phases and Job Steps.
Stop and restart the job at any time and at any step using Restart Job From Specific Step.
Understand Durations of Job Steps.
Review Controller Impact.
AppDynamics DEXTER outputs data into Output folder specified in -o/--outputfolder command-line parameter. By default, output folder is:
-
"C:\AppD.Dexter.Out"is assumed on Windows -
"%HOME%\AppD.Dexter.Out"is assumed on Mac and Linux
For example, if you specified myextract.json, the Output folder is C:\AppD.Dexter.Out\myextract on Windows or /user/home/AppD.Dexter.Out/myextract on Mac/Linux.
Data from Controller that is extracted during Extract phase is saved to [Output Folder]\Data folder.
Converted data that is produced during Index phase is saved to [Output Folder]\Index folder.
Final CSV files and Excel reports that are produced during Report are saved to [Output Folder]\Report folder
There is a lot of file I/O happening in the Output folder. Remove the Output folder from any Antivirus monitoring, otherwise Extraction and Indexing is going to take a lot longer.
AppDynamics DEXTER builds Excel documents from the CSV files.
All Microsoft Office products (2013/2016/2019/365/Office Online) can handle these Excel reports. Occasionally, older versions (2013, 2016) may complain about workbooks being corrupt, but it is mostly due to harmless conditional formatting forumulas.
Google Sheets can handle these Excel Reports although some displays in Pivots is a bit off.
Libre Office struggles with rendering of some tables but it gets full grades for trying. You can easily load CSV files instead.
| Report | Image | Purpose |
|---|---|---|
| Detected APM Entities |
 Click to View Video 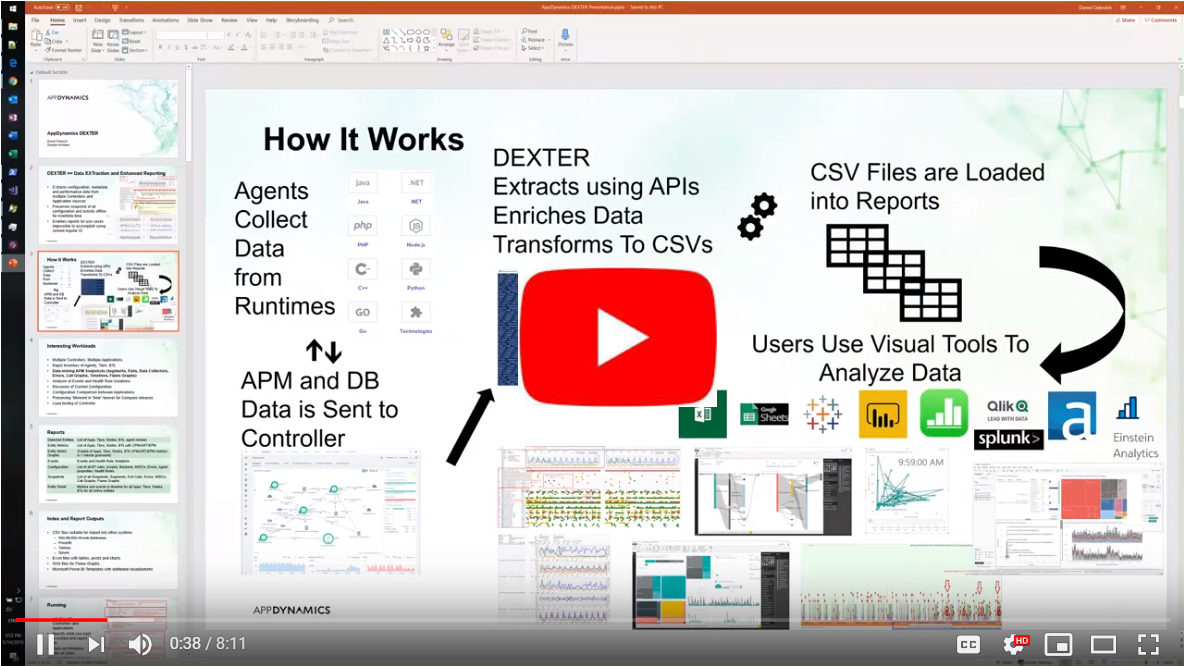
|
Detected APM Entities report shows information about each and every detected Entity (Application, Tier, Node, Business Transaction, Backend, Service Endpoint, Errors and Information Point) in APM Applications |
| Detected SIM Entities |  |
Detected SIM Entities report shows information about each and every detected Entity (Tier, Node, Machine, Network Adapter, CPU, Disk, Container and Process) in SIM Applications |
| Detected DB Entities | 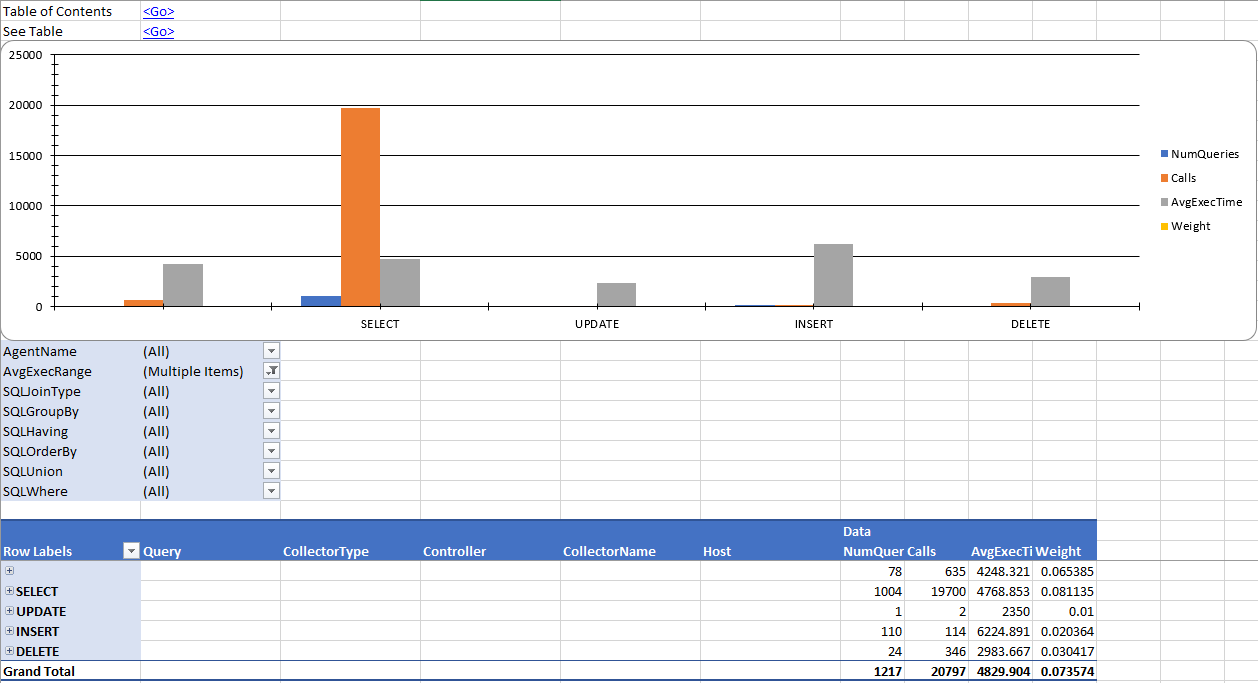 |
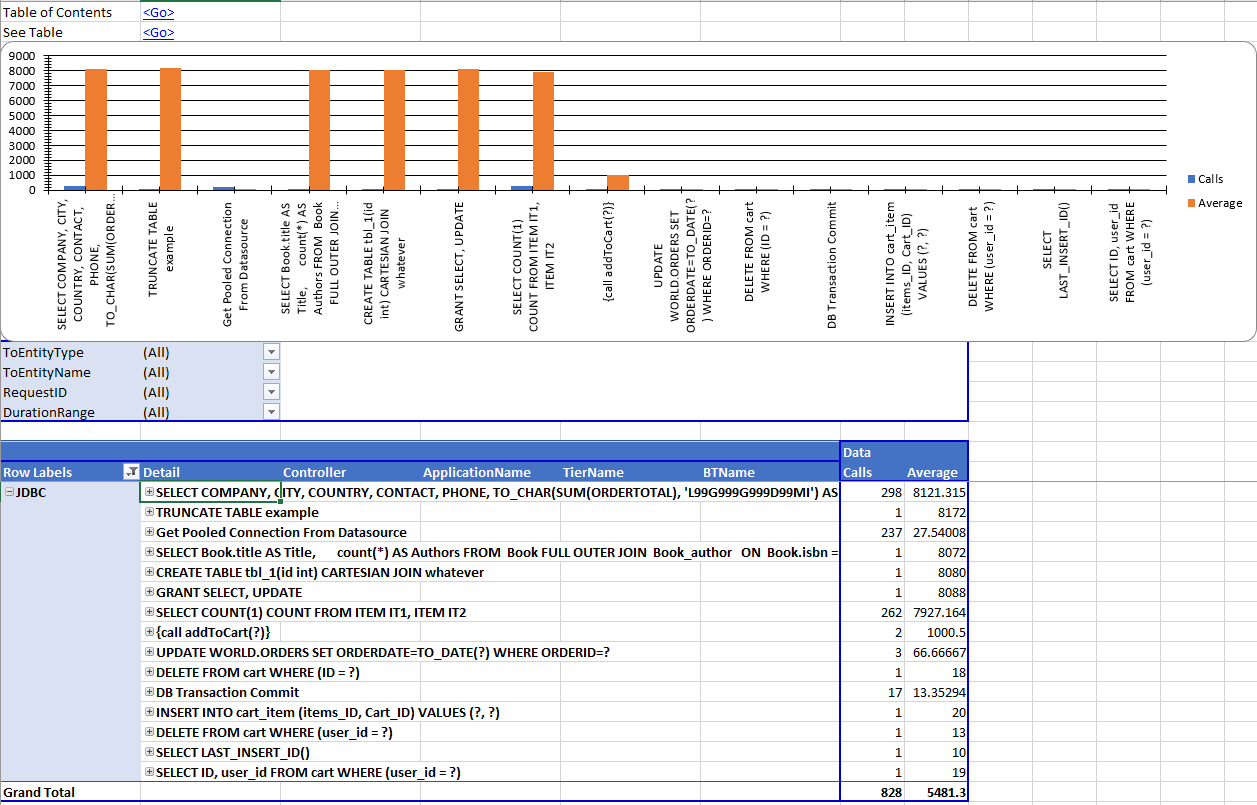
Detected DB Entities report shows information about each and every detected Entity (Collector Definitions, Collectors, Queries, Users, Sessions, Blocking Sessions, Clients, Databases, Modules, Programs, Wait States and Related Business Transactions) in DB Collectors |
| Detected WEB Entities |  |
Detected WEB Entities report shows information about each and every detected Entity (Pages, AJAX Requests, Virtual Pages, Resources and Geolocations) in WEB Applications |
| Detected MOBILE Entities | 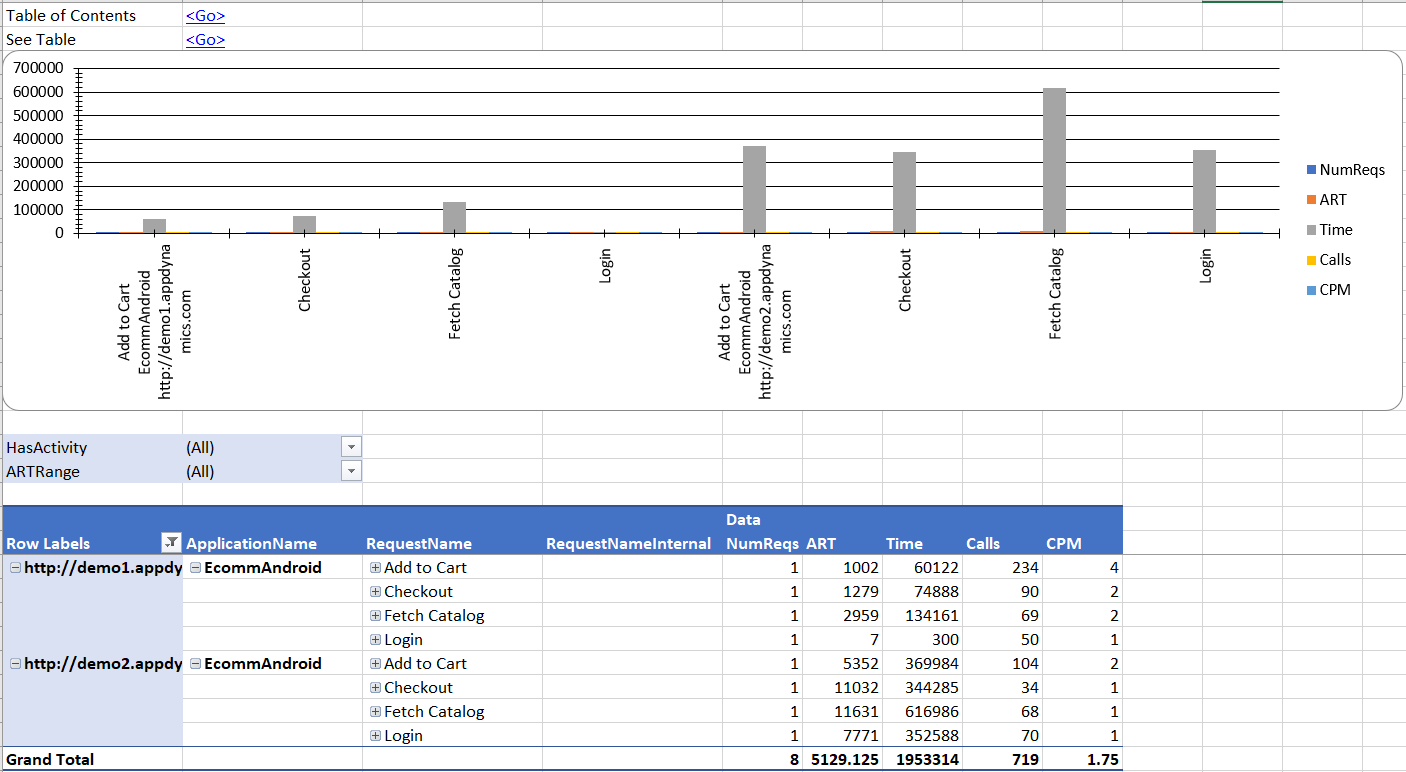 |
Detected WEB Entities report shows information about each and every detected Entity (Network Requests, Correlated Business Transactions) in MOBILE Applications |
| Detected BIQ Entities |  |
Detected WEB Entities report shows information about each and every detected Entity (Searches, Widgets, Saved Metrics, Business Journeys, Experience Levels, Schemas and Fields) in BIQ Applications |
| Entity Metrics |
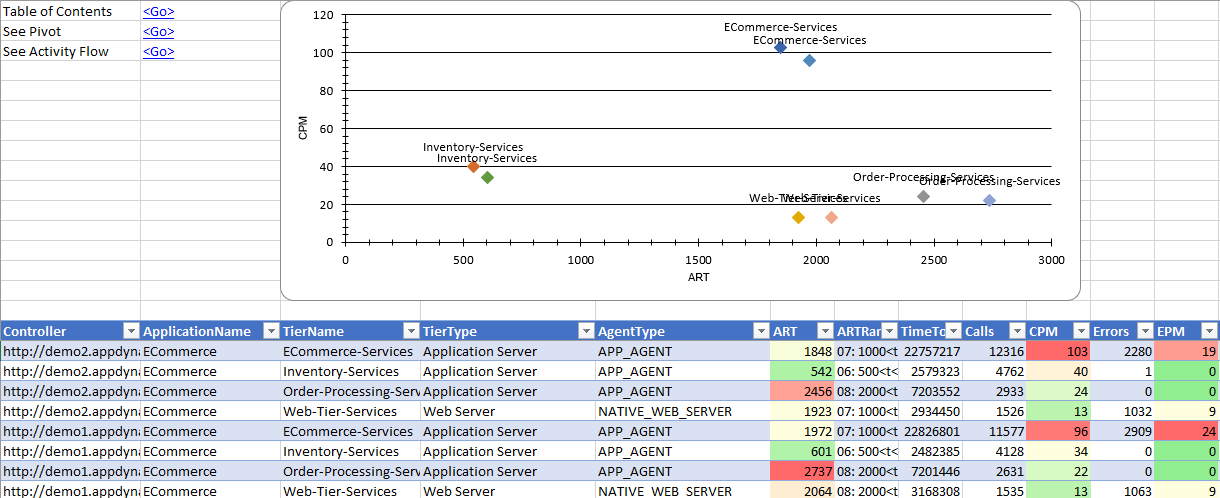 Click to View Video 
|
Entity Metrics report shows summary and graphs for all Metrics for each and every detected Entity (Application, Tier, Node, Business Transaction, Backend, Service Endpoint, Errors and Information Point)in APM Applications |
| Entity Metric Graphs |
 Click to View Video 
|
Entity Metric Graphs report combines information about detected Entities with their Metric data to show all entities with activity in the requested time ranges, and provides visual graphs of all of the metrics that were requested |
| Registered APM Metrics |
 |
Registered APM Metrics report shows list of all metrics registereb by nodes and tiers and business transactions in APM Application, and also tells you whether they had any reported values in last hour of the reporting interval |
| Entity Flowmaps |  |
Entity Flowmaps report shows activity flow for all Applications, Tiers, Nodes, Business Transactions and Backends for APM Applications. |
| Events and Health Rule Violations |  |
Events report provides information about Events and Health Rule Violations in the requested time range in all Applications, as well as Controller Notifications and Audit Log events |
| Entity Details |
 Click to View Video 
|
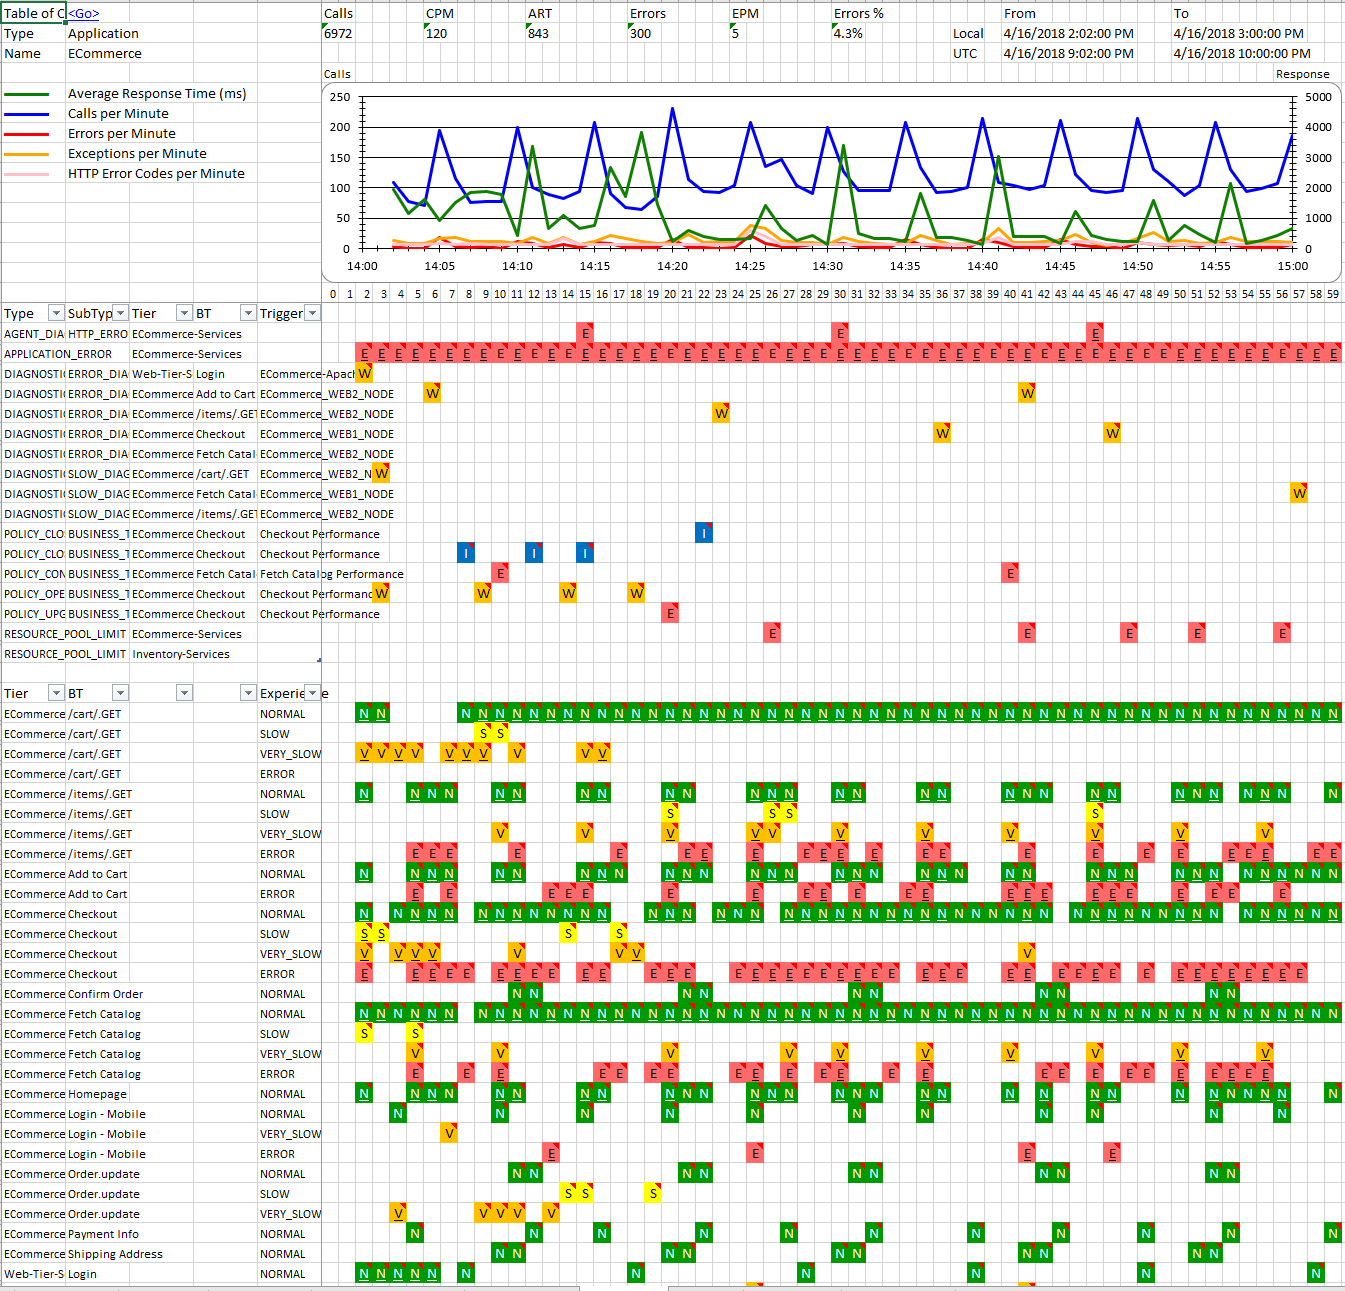
Entity Details report provides summary view into all activity that affected this Entity, including Timeline view |
| Snapshots |
 Click to View Video 
|
Snapshots report provides information about Snapshots, Segments, Exit Calls, traversed Service Endpoints and Business Data for all Snapshots |
| Snapshot Method Calls |
 Click to View Video 
|
Snapshot Method Calls report provides information about Snapshot Call Graphs for all Snapshots |
| Individual Snapshot |  |
Individual Snapshot report provides information about single Snapshot |
| Configuration |
 Click to View Video 
|
Configuration report provides information about Controller Settings and Application configuration, as well as comparison between each of the rules in all Applications |
| Users and Permissions |  |
Users, Groups, Roles and Permissions report shows information about each and every security entity (User, Group, Role and Permission) and their relationship in Controller |
| Dashboards |  |
Dashboards report provides information about Dashboard, their Widgets and Time Series in Controller |
| Health Check |  |
The Health Check report provides a health grade of key application configurations |
AppDynamics DEXTER includes templates for Microsoft PowerBI, which is a great visual analytics tool that is free for local desktop use on Windows workstations.
PowerBI report templates are provided with AppDynamics DEXTER in PowerBITemplates folder.
To create a PowerBI report with the data, open PowerBI report template (*.pbit file) and provide path to the [Output]\Report folder when prompted.
You can then save the results as *.pbix report file. These can be uploaded into PowerBI Server or PowerBI Online for displaying in the browser.
PowerBI templates are built with en-US locale and templates do not automatically adjust to your machine’s locale.
This can cause errors during load of data as the date parsing gets confused.
Perform these steps to correct these load errors:
- Accept the errors encountered during the load process
- Click
File\Optionsmenu - Navigate to
Settings\Options\Current File\Regional Settings - Set the Locale drop-down to locale of the system on which the report was produced
- Re-run all the queries using
Refresh all data sourcescommand
| Report | Image | Purpose |
|---|---|---|
| Detected APM Entities | 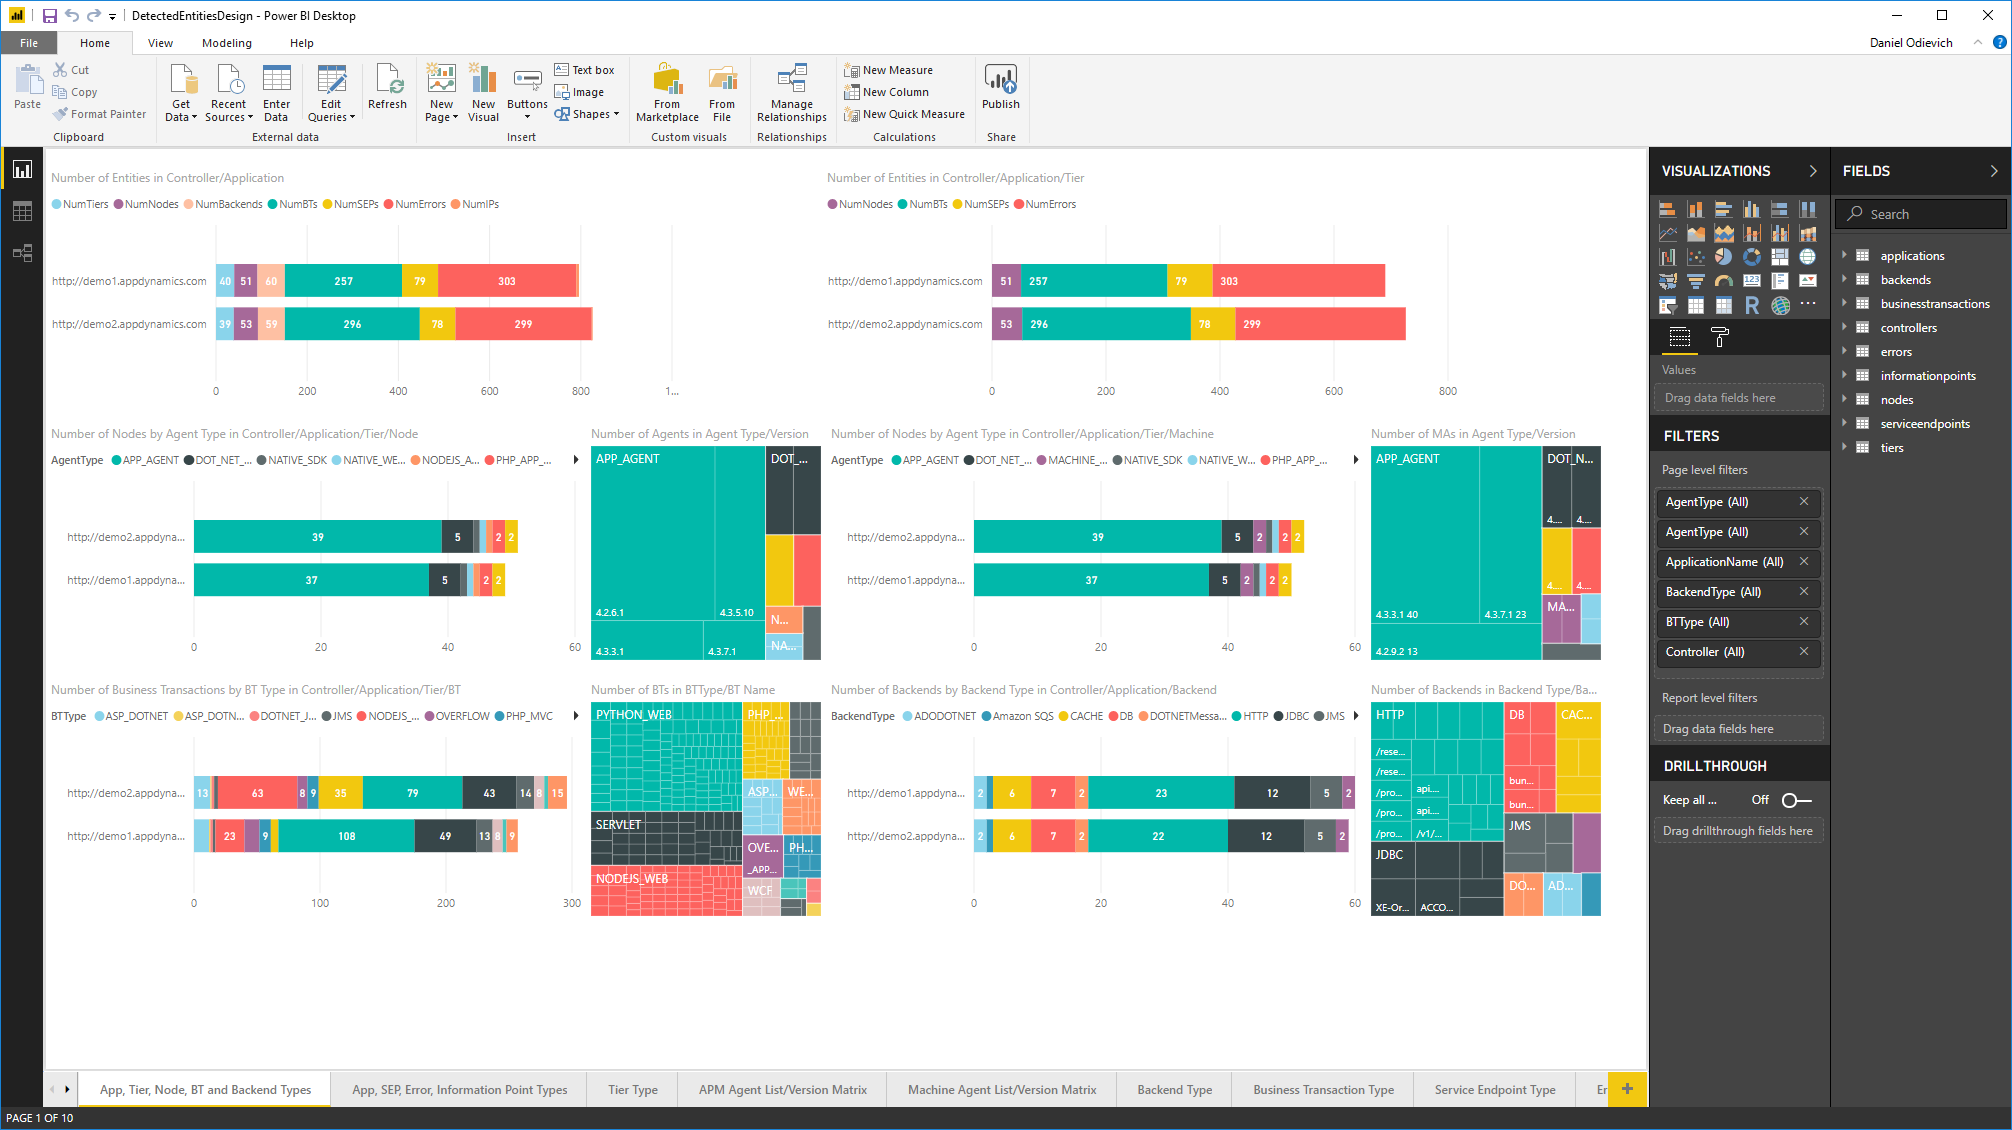 |
Detected Entities report offers interactive visual exploration of detected entity data |
| Detected DB Entities | 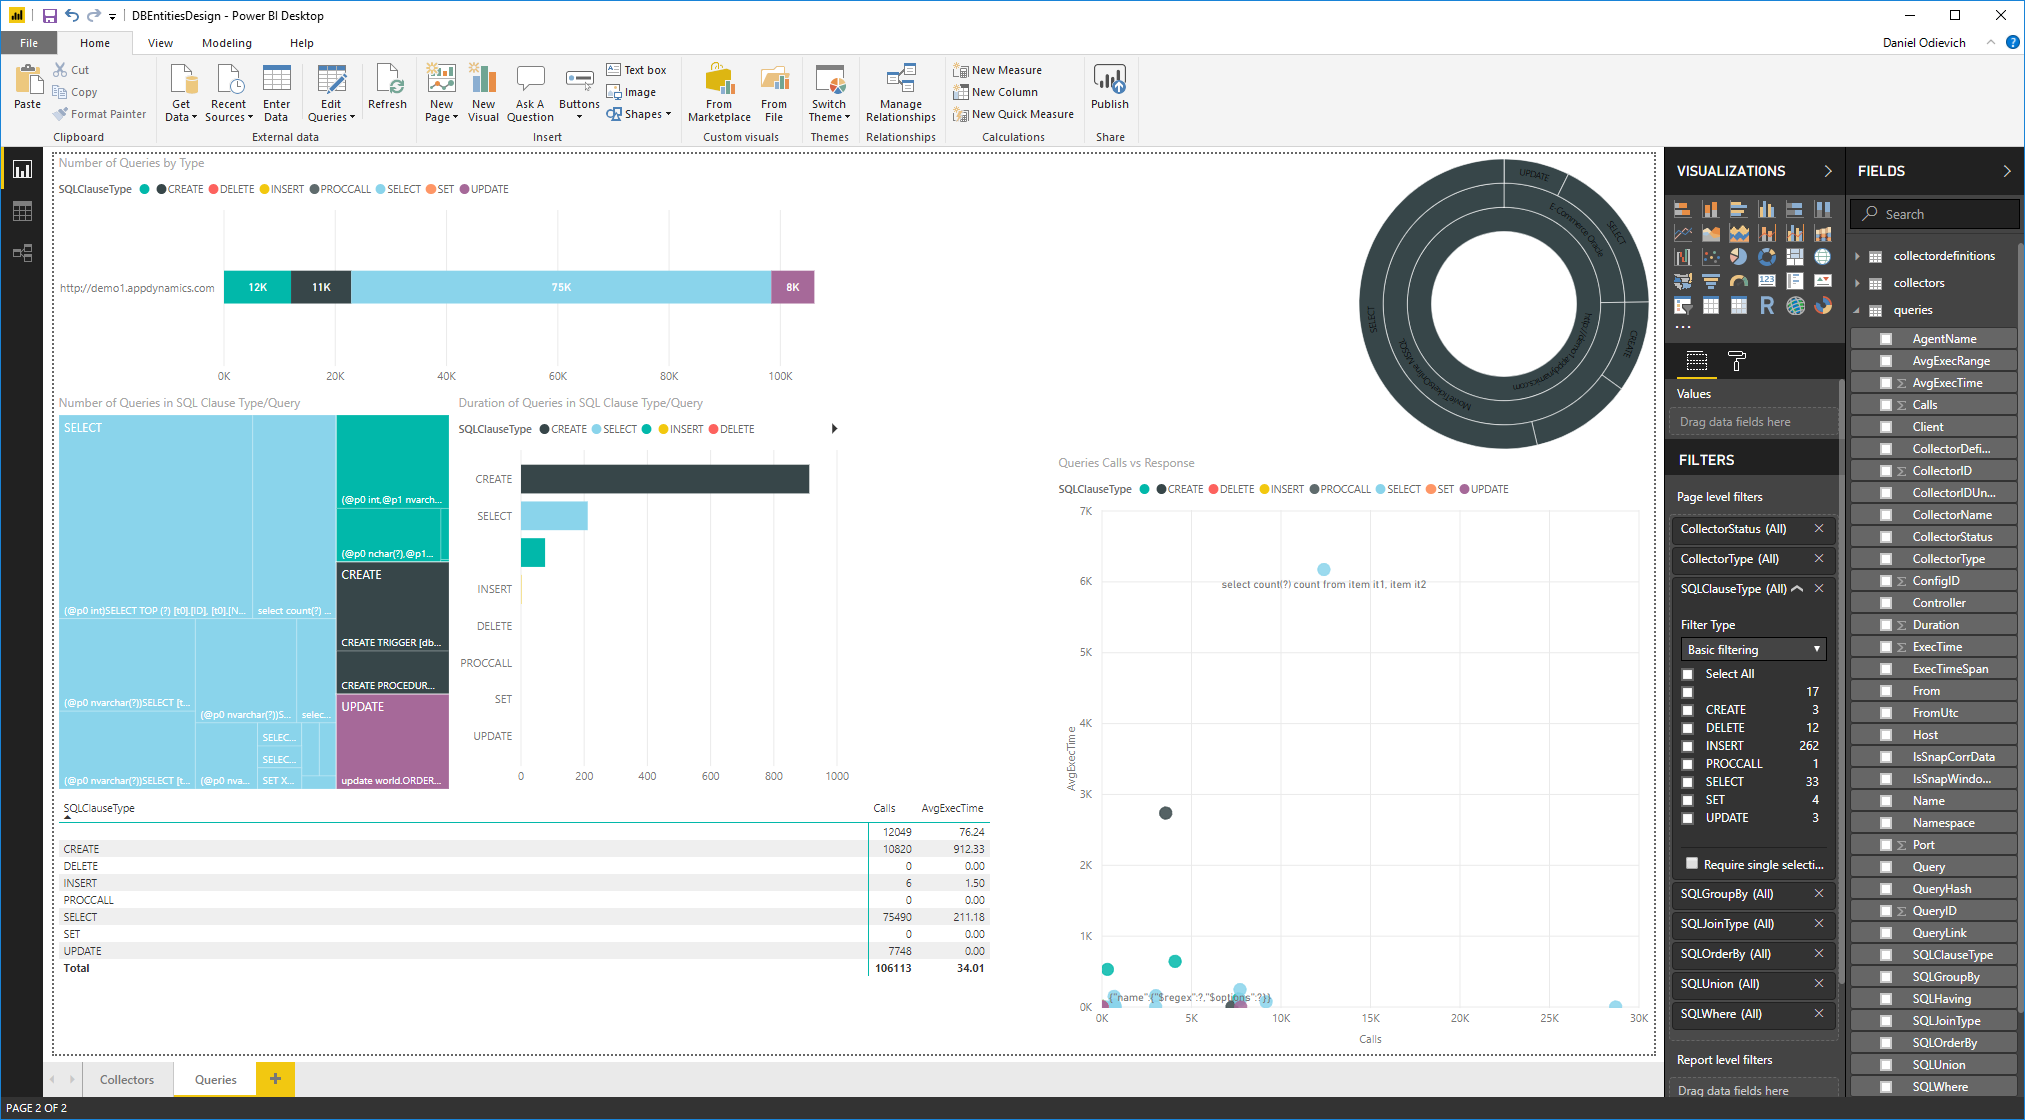 |
Detected DB Entities report offers interactive visual exploration of all Collectors and Queries |
| Entity Metrics |  |
Entity Metrics report offers interactive visual exploration of CPM, ART and EPM metrics |
| Entity Flowmaps |  |
Entity Flowmaps report shows interactive visuals for Flow Maps of Applications, Tiers, Nodes, Business Transactions and Backends using flow diagrams |
| Events and Health Rule Violations |  |
Events report offers interactive visual exploration of Event and Health Rule Violation data |
| Snapshots |  |
Snapshots report offers interactive visual exploration of all Snapshot data |
| Snapshot Method Calls | 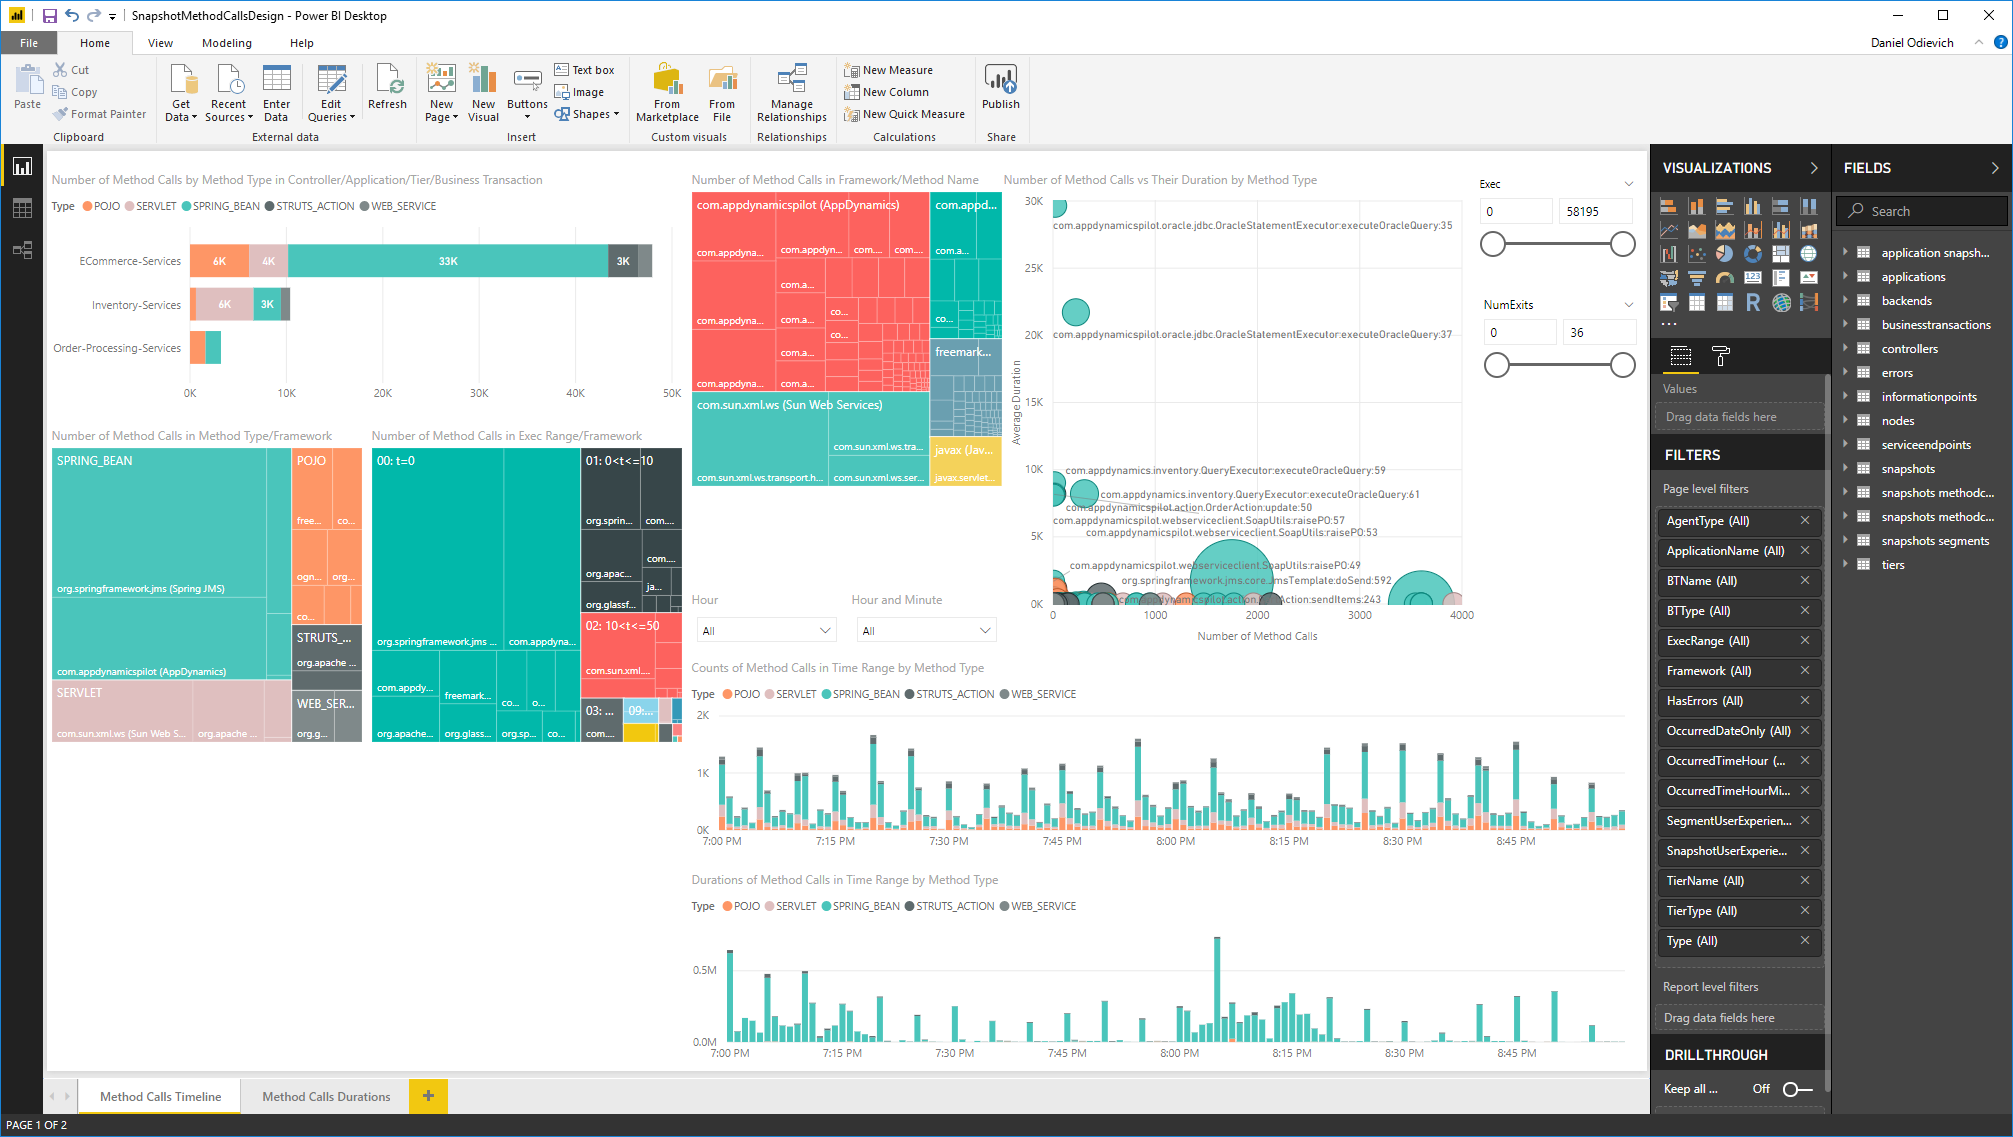 |
Snapshot Method Calls report offers interactive visual exploration of all Snapshot Call Graphs |
AppDynamics DEXTER includes templates for Tableau, which is a really powerful visual analytics tool.
Tableau report templates are provided with AppDynamics DEXTER in TableauTemplates folder.
To create a Tableau report with the data, copy report template (*.twb file) to the [Output]\Report folder and open it from that location. When prompted to, choose the Regenerate the extract option, click OK, and locate the folder where to store Snapshots.hyper Hyper database file. We recommend you store it in the [Output]\Report folder.
After report renders, save it. The resulting file can be uploaded into Tableau Server or Tableau Online for displaying in the browser.
Tableau templates are built with en-US locale and templates do not automatically adjust to your machine’s locale.
This can cause errors during load of data as the date parsing gets confused.
Perform these steps to correct these load errors:
- Accept the errors encountered during the load process
- Click
Data Sourcetab or clickData\<datasource>.csv\Edit Data Sourcemenu -
Data Sourcetab will open - Click on drop-down menu of the the
<datasource>.csvin the Data Source pane - Click
Text File Properties - Set the Locale drop-down to locale of the system on which the report was produced
- Click
Data\Refresh Data Sourcecommand - Switch to any of the sheets
- Click
Data\Refresh All Extractscommand
| Report | Image | Purpose |
|---|---|---|
| Entity Metrics |  |
Entity Metrics report offers interactive visual exploration of performance metrics |
| Snapshots |  |
Snapshots report offers interactive visual exploration of all Snapshot data |
| Snapshot Exits |  |
Snapshot Exits report offers interactive visual exploration of Snapshot Exit data |
| Snapshot Method Calls |  |
Snapshot Method Calls report offers interactive visual exploration of all Snapshot Call Graphs |
| Report | Image | Purpose |
|---|---|---|
| Flame Graph and Chart |
 Click to View Video 
|
Flame Graph and Flame Chart report provides single-pane visualization of all Call Graphs in all Snapshots |
| Entity Dashboards |  |
Entity Dashboards report shows screenshots of the Flowmaps of the APM Entities |
At the moment Dexter is Community Supported only. If you have a problem you could create a new Issue in Issues area and hopefully a knowledgeable community member will help out if they can.
Here are the things I am planning on adding to future versions of AppDynamics DEXTER:
-
Node JVM properties extract (4.4 only because before that it was all in Flash)Completed in 1.0.0.27 -
Configuration comparison report of the selected dataset (like https://github.com/Appdynamics/ConfigurationComparer only better)Completed in 1.0.0.29 -
Extraction and reports on Server Visibility metadataand maybe metrics - Completed in 1.0.0.32 -
Better storage and faster speed of processing of Snapshots during Extraction and Indexing phase- Completed in 1.0.0.33 -
Extraction and Reports on Database Monitoring- completed in 1.0.0.35 -
Controller Audit log and correlation with other events- completed in 1.0.0.36 -
List of agents enabled for Dev Mode- completed in 1.0.0.36 -
Report on RBAC (User, Group and Role) configuration- completed in 1.0.0.36 -
Extraction and reports on Web and Mobile End User Monitoring metadata and metrics- completed in 1.2.37.0 -
Extraction and reports on Analytics metadata and metrics- completed in 1.2.37.0 -
Reports on Dashboards- completed in 1.2.37.0 -
All application type report on Policies, Alerts and Health Rules- completed in 1.2.37.0 -
HTTP and Email templates configuration Report- completed in 1.2.37.0 -
Reports on Deployed Licenses and License Keys- completed in 1.2.39.0, removed in 1.2.41.x -
Agent availability report- completed in 1.2.39.0 -
Health check details report including assessment of entities metrics and configuration in single document- completed in 1.2.47.0 -
Tableau visual analytics reports, similar to those already available for PowerBI- released some in 20.5.0.0, completed the rest in 20.6.0.0 - Compare states report - comparing two exports of data and showing differences in Configuration and Performance
- Home
- Getting Started Walkthrough
- Run
-
Excel Reports
- Detected APM Entities
- Detected SIM Entities
- Detected DB Entities
- Detected WEB Entities
- Detected MOBILE Entities
- Detected BIQ Entities
- Entity Metrics
- Entity Metric Graphs
- Registered APM Metrics
- Entity Flowmaps
- Configuration
- Events and Health Rule Violations
- Entity Details
- Snapshots
- Snapshot Method Calls
- Individual Snapshot
- Users and Permissions
- Dashboards
- Health Check
- PowerBI Reports
- Tableau Reports
- Browser Reports


