-
Notifications
You must be signed in to change notification settings - Fork 0
lynsyn_viewer
This tool can be used to perform power measurements on a target system, and if JTAG is available also correlate power measurements to source code by performing program counter (PC) measurements. The tool can also visualise the data, or visualise data sampled with the lynsyn_sampler tool.

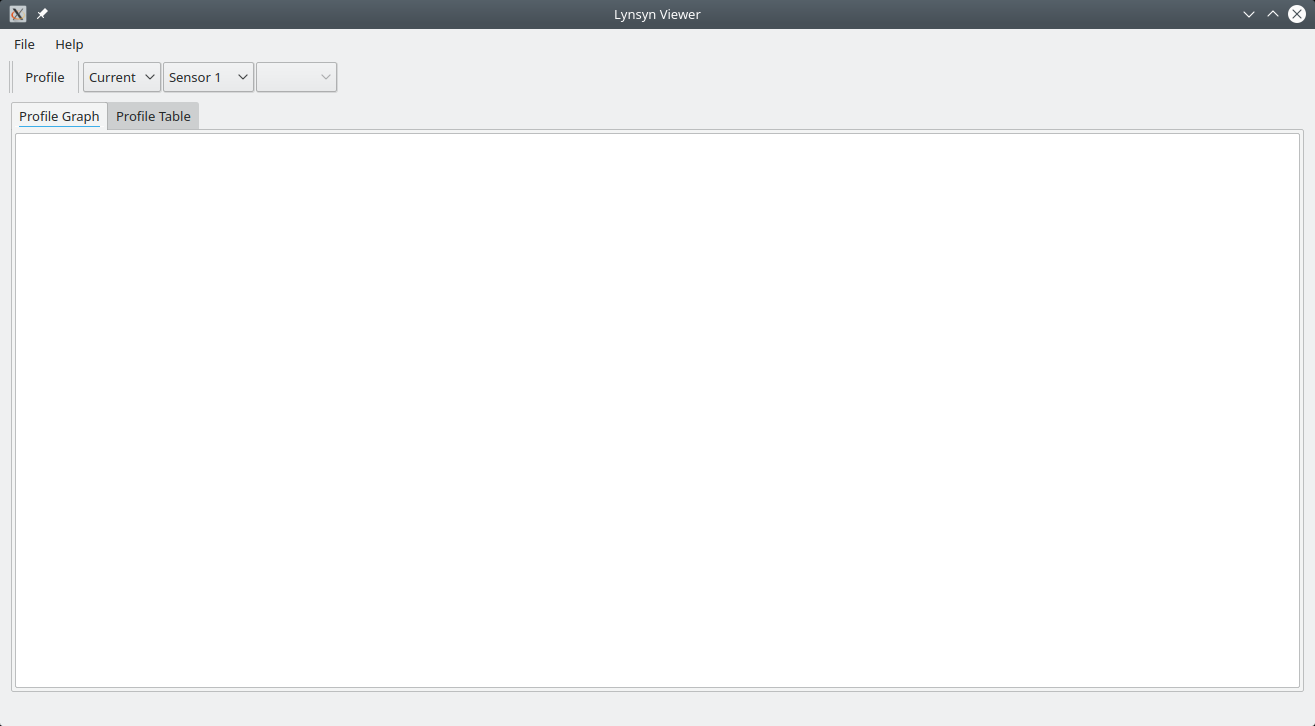
The lynsyn_viewer GUI after start-up is shown above. There are three main tasks that can be performed in this GUI:
- Perform power and/or PC measurements and visualise the results
- Import measurements from a CSV file and visualise the results
- Export measurements to a CSV file
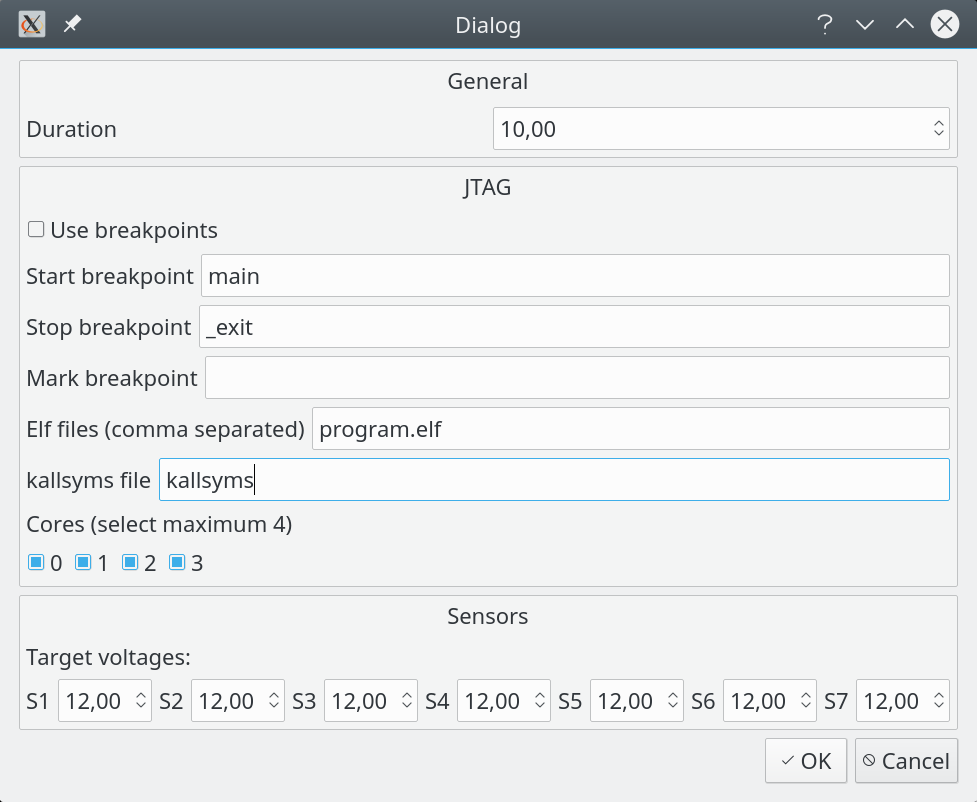
Press the toolbar button "Profile". The tool will then try to connect to the target board over JTAG. A dialog will afterwards appear which lets you specify how to perform the profiling session:

The possibilities of this dialog depends on both the Lynsyn version available and the JTAG capabilities of the target board.
General profiling options:
- Duration: Select how long you want to profile. This is used when not using JTAG breakpoints to start and stop the profile session
JTAG profiling options (only available if JTAG is connected):
- Use breakpoints: Select this if you want to specify at which points in the program execution you want to start and stop the profiling session (instead of using a time limit)
- Start and stop breakpoint: Elf symbols to use as breakpoint addresses. When the program reaches the start symbol, sampling will start. When the program reaches the stop symbol, sampling will end.
- Mark breakpoint: An elf symbol to use as a marker. When the program reaches this symbol, a mark will be inserted into the sampling data. This is useful to organise and mark different phases of the program while sampling.
- Elf files: A list of elf files to use when looking up symbols and for later correlation of measurements with program code
- kallsyms file: If profiling a linux system, a kallsyms file can be provided such that power measurements can also be correlated with the linux kernel
- Cores: Choose the cores you want to sample the program counter from. The sampling frequency increases with decreasing number of cores, so only choose what you need.
Sensor options (only available on Lynsyn Original, Lynsyn Lite also measures voltage):
- Target voltages: Specify the voltage of the power supply connected to the different sensors
After setting all options, press "Ok" to continue, and Lynsyn will start sampling until either a timeout or the stop breakpoint is reached.
The lynsyn_viewer tool stores its sampled data in a sqlite database. To use the data externally, it can be exported to a CSV file. This is done through the menu option "Export CSV". Likewise, a compatible CSV file can be imported and visualised using the menu option "Import CSV". Optionally choose the application elf and possibly kallsyms file to correlate measurements with source code.
The main feature of lynsyn_viewer is to visualise measurement data, collected either from the lynsyn_viewer tool itself, or from the lynsyn_sampler (via CSV import).
There are two main ways to view the profile data: A graph and a table. Use the tabs in the main window to switch between them.

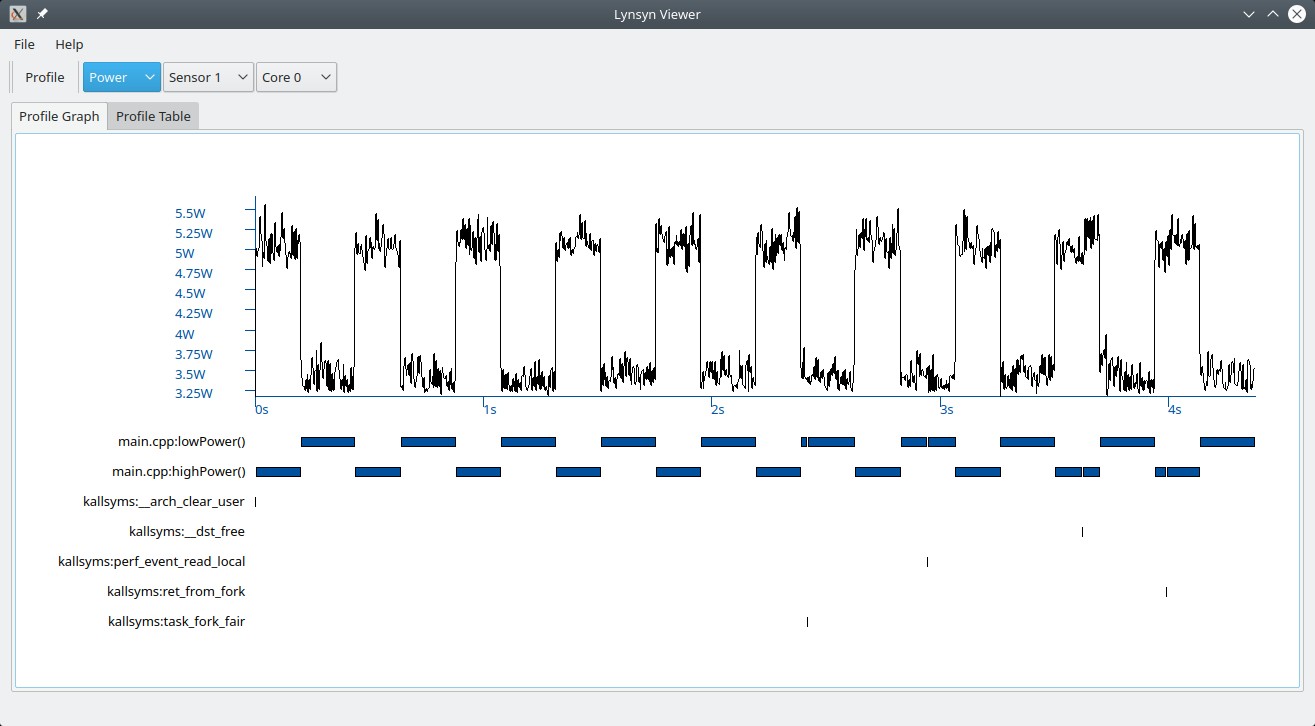
This visualisation is a graph with time on the x axis and measurement data on the y axis. The measurement data to plot is selected on the toolbar. Under the measurement graph (but using the same time axis) is a gantt like graph where the CPU core activity (active functions) are visualised.
Use the mouse scroll wheel together with modifier keys on the keyboard (shift, alt, control) to zoom or adjust different aspects of the graph.
Use the mouse and click-and-drag a region to zoom in on that region. Left click a point to get point data in the status bar. Use right mouse button to view the entire dataset.

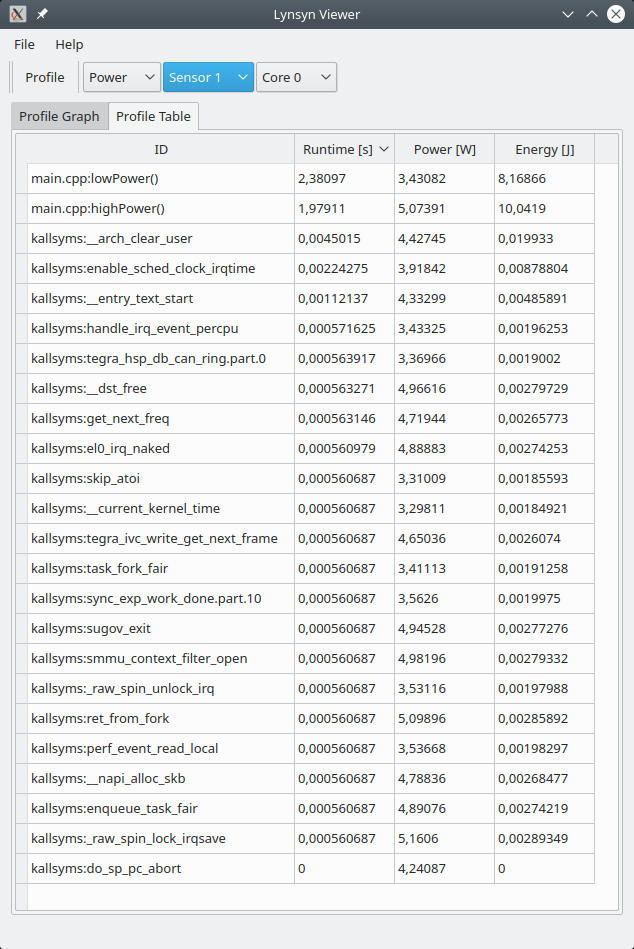
The table view is only useful when doing JTAG PC sampling. The table shows the list of all functions with time, energy and average power spent by each function. Note that this table shows "self" data, not accumulative data. This means that a function will only show the time/power/energy for the part that is exclusivly within the function itself, not including any called functions.
Lynsyn Wiki