First Steps
csp is a stream processing library that integrates real-time and historical playback workflows. Users compose a directed acyclic graph (DAG) of transformations and run them as a single pipeline with multiple data sources.
In this introductory tutorial, you will write a basic csp program to monitor production deployments.
Real-time data is continuously updated in a stream of events that occur at unpredictable times. Stream processors handle these events and analyze their data so that underlying insights can be achieved in real-time. Each application is driven by updates to the input source values which propagate down the data pipeline. In csp, we refer to the input changes as "ticks" and write the analysis workflow as a directed graph.
csp programs are written in a functional-style, and consist of:
- runtime components in the form of
csp.nodemethods, and - graph-building components in the form of
csp.graphmethods.
from datetime import datetime, timedelta

import csp
from csp import ts
csp defines a high-level ts type that denotes a time series input. The ts is to csp as the Series is to pandas or the array is to numpy: it is the fundamental data unit. A time series is a single stream of typed values. Whenever the stream is updated, any consumer of that data is invoked. Consumers are nodes or output adapters that ingest time series data.
When you access a time series within a node, you access the last value of the time series. You can also store a fixed or variable sized history (see CSP Node) for any input time series. When you access a time series within a graph, you access the edge of the time series. This is simply the type, input and output definition of the data; it is used for building the graph at startup and ensuring type validation.
The computational building blocks of any csp program are the nodes. You can use the @csp.node decorator to create a node that matches regular expressions. This will be useful for analyzing logfiles generated by our production deployments.
import re

@csp.node
def regex_match(log_line: ts[str], regex: str) -> ts[bool]:
    if re.match(regex, log_line):
        return True
The regex_match ingests a time series of strings which are the lines of our logs, and matches them against the expression "regex". The node returns a time series of Booleans. If the expressions match, then we output True; if they don't, then we don't output a value at all. This stops any downstream consumers from executing.
Important
csp nodes are strictly typed, and the type is enforced by the C++ engine.
The node will be invoked whenever the value of log_line is updated. Since we have a single input, we do not need to check whether log_line has ticked or if its valid. If there are multiple ts inputs in a csp.node, it is a good practice to check that each input is valid before accessing its value.
csp has an extensive set of pre-written nodes for common computations. Check out the API Reference documentation pages to learn more.
Next, we will create a csp.graph that analyzes the log messages from our deployment. For this example, we will use simulated log messages from a csp.curve. Graph components are only executed once during application startup to construct the graph. Once the graph is constructed, csp.graph code is no longer needed.
start = datetime(2020,1,1)

@csp.graph
def monitor_deployment():
    log_msgs = csp.curve(typ=str, data=[
        (start, 'WARNING: Load is heavy @ 90%'),
        (start + timedelta(minutes=1), 'INFO: New connection on port 42'),
        (start + timedelta(minutes=4), 'WARNING: Load is heavy @ 95%'),
        (start + timedelta(minutes=6), 'INFO: New connection on port 43'),
        (start + timedelta(minutes=9), 'CRITICAL: Overloaded, cannot connect new users!'),
    ])

    load_warnings = csp.count(regex_match(log_msgs, r'.*WARNING.*Load.*'))
    new_connections = csp.count(regex_match(log_msgs, r'.*INFO.*New connection.*'))

    csp.print("load_warnings", load_warnings)
    csp.print("new_connections", new_connections)
In this graph, we count the number of load-related warnings as well as the number of new connections.
To execute a csp application we use the run function. Each run starts at a starttime and ends at an endtime. For the example above, we can run the graph using:
csp.run(monitor_deployment, starttime=start, endtime=timedelta(minutes=10))The program will produce the following:
2020-01-01 00:00:00 load_warnings:1
2020-01-01 00:01:00 new_connections:1
2020-01-01 00:04:00 load_warnings:2
2020-01-01 00:06:00 new_connections:2
Take a moment to reason with this output. Each csp.count node is only invoked when its regex_match ticks a value, and each regex_match node only ticks a value when the match is valid.
To visualize this graph, you can install graphviz and use csp.show_graph to view and save the image.
csp.show_graph(my_graph, graph_filename="tmp.png")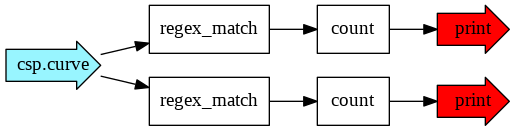
The blue arrows (csp.curve) indicate inputs and the red arrows (csp.print) indicate outputs. The nodes, in our case regex_match and count, are denoted by rectangles.
Check out the expanded and complete example: e3_show_graph.py.