fix: re-enable table filter #9593
Conversation
22e63fb to
416b620
Compare
Codecov Report
@@            Coverage Diff             @@
##           master    #9593      +/-   ##
==========================================
- Coverage   70.49%   65.61%   -4.88%
==========================================
  Files         574      575       +1
  Lines       30073    30091      +18
  Branches     3054     3066      +12
==========================================
- Hits        21200    19745    -1455
- Misses       8762    10160    +1398
- Partials      111      186      +75
Continue to review full report at Codecov.
|

| // `all_columns` is from NOT GROUP BY mode (raw records) | ||
| const columns = groupby.concat(all_columns); | ||
| columns.forEach(column => { | ||
| configs.columns[column] = undefined; |
There was a problem hiding this comment.
would null be better here? seems like that might match the filterbox empty value? to me that's more an explicit "undefined" versus undefined
There was a problem hiding this comment.
To me, null means users specifically choose an empty value for the filter. undefined is more like the "data not yet available" default.
In FilterBox, the defaultValue is also undefined, not null:
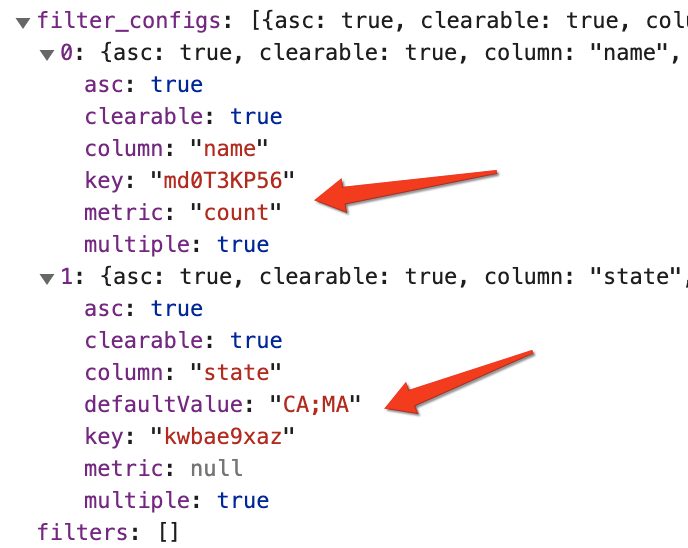
Since there is no way to set a default filter for table charts, using undefined to indicate "not set" seems more appropriate to me.
| }), | ||
| {}, | ||
| ), | ||
| }; |
There was a problem hiding this comment.
Reduce is confusing. We should avoid reduce: https://twitter.com/jaffathecake/status/1213077702300852224
There was a problem hiding this comment.
I feel everyday in the internet there will someone claim one or another new theory...🤷♀️
I saw so many ppl object to his opinion. Did he offer any reason WHY he made claim?
There was a problem hiding this comment.
Reduce code is often very difficult to read and plain old for loops or forEach functions are almost always easier to understand.
Programs should favor simplicity and clarity, not succinctness.
This guy works for Google and is in charge of promoting new browser features such as Service Workers.
There was a problem hiding this comment.
@ktmud Realize this is old, but wanted to add my 2cents. Performance considerations aside, I find reduce to frequently be faster to write and more readable than for loops and forEach. The key reasons being that I can cognitively follow the steps in sequence by knowing the goal is to turn A into Z, which means somewhere along the chain, I must take that step to go from A to C. As soon as that becomes imperative, I lose the ability to follow it sequentially since variables, intermediary steps, etc. must be declared up front. This leads me to have to make assumptions about what the purpose of the code is to understand the context of what I'm looking at. In a similar vein, that's why I typically hate non-curried underscore / lodash, because it reverses the call order and makes you start at the innermost function call.
That being said, the real reason why we write code that way is to have the ability to write it to pause / resume execution at any point in the chain (i.e. generators).
There was a problem hiding this comment.
Interestingly, I find reduce harder to read also because I was not able to follow it sequentially. It kind of places the input and output in a very twisted flow:
input.reduce((intermediateOutput, input) => {
   return intermediateOutput
}, output);
Maybe I just didn't use it often enough, but every time I encounter a reduce function, I always have to think what the output look like and sometimes it could even be difficult to find where the output object was initialized.
For this specific case, the original code looks like this:
    const updatedLabels  = {
      ...configs.labels,
      ...Object.entries(TIME_FILTER_MAP).reduce(
        (map, [key, value]) => ({
          ...map,
          [value]: TIME_FILTER_LABELS[key],
        }),
        {},
      ),
    };
    configs.labels = updatedLabels;
Without reduce, it's just:
    Object.entries(TIME_FILTER_MAP).forEach(([key, column]) => {
      configs.labels[column] = TIME_FILTER_LABELS[key];
    });
Is reduce really faster to write and read?
92b8f10 to
37a5fb5
Compare
|
|
||
| /** | ||
| * Check if a chart is one of the filter chart types, i.e., FilterBox | ||
| * and any charts with `table_filter = TRUE`. |
There was a problem hiding this comment.
Even the chart is not a table viz, it can still have table_filter = TRUE? this sounds very problematic. Does that mean any chart can be filter?
There was a problem hiding this comment.
Yes. That was how table filter was originally implemented. I think it’s probably OK. Tableau also has this feature where you can filter/highlight by categorical values from linked charts.
There was a problem hiding this comment.
but in the code you only have getFilterConfigsFromTableChart and getFilterConfigsFromFilterBox right? So only 2 viz types are eligible to work as filter.
There was a problem hiding this comment.
For now. But the design should account for generic cases, which is why I proposed to change “table_filter” to a more generic name. Current implementation also tightly couple viz type with the filters, which kind of goes against our goal of making visualizations more pluggable. But we can deal with that one at a time.
| : getFilterConfigsFromFilterBox(form_data); | ||
|
|
||
| // if current chart has preselected filters, update it | ||
| if (filters) { |
There was a problem hiding this comment.
this function getFilterConfigsFromFormdata, is used when dashboard get loaded in browser, and when user apply a filter. By adding this code block, will user applied filter will always be overwritten by dashboard preselected filters?
There was a problem hiding this comment.
Hmm, I don’t think this is actually in use. It comes from my previous attempt with some larger refactoring, which didn’t work out in the end. Will clean this up.
I am not sure you tested all filter related use cases. There are some pretty complicated logic for filter_box's and filter's scope:
I want to make table filter as simple as possible, otherwise it's really hard to maintain the majority usage. I suggest:
No matter you want to make table filter fully work as filter_box filter or not, please add some unit tests and Cypress e2e tests for table filters, to show what functions that table filter will support. |
I agree. Actually tried to do a bigger refactor to simplify some code pieces, but it ended up breaking many of the test cases you mentioned. Current solution is the simplest I could find that didn't break anything. To be honest, I'm even not sure about the value of this feature. Under which use cases it is irreplaceable by a FilterBox? If the burden of maintaining it outweighs the benefits, I'm in favor of officially deprecating it and focusing on improving the filter box instead. |
|
If we are to keep this feature, I'd prefer not to exclude the table filters from scopes configuration. Currently there is no easy way to propagate the selected filter values to all charts without tapping into |
|
I kind of do not want to support full filter functionalities on table viz, because |
|
You do what you do with FilterBox charts. It'd be the same as adding or removing a FilterBox from the dashboard. We just need to make sure it doesn't throw errors when it tries to read/write |
|
|
|
Awesome! Good to see this feature! Tagging @bolkedebruin who I know was blocked by this |
I mean, it's the same as removing a FilterBox from the dashboard. Do we do anything special right now for filter boxes when they are removed from the dashboard? My point is, there is no need for special treatment. If we think outdated metadata would be an issue, then it must be an issue for FilterBox, too.
I'm OK with NOT merging this fix if we think there are too much trouble or a better solution down the line. @mistercrunch , question for you and @bolkedebruin ,
It seems there is a significant risk to future maintenance cost if we reintroduce this feature. Kind of feel we should deprecate it for now until we have a better idea on how to make this more robust. |
My suggestion is to enable table (or chart) filter, for backward compatible, but its state should not be persist into dashboard metadata. For every page load, during initialization dashboard can add these temporary filters into dashboardFilters state. when user trigger filter events from chart, dashboardFilters will handle state changes, so that at this dashboard visit, these chart filters can work as filter. The difference from filter_box filter is:
|
|
If The user interactions makes sense. I agree some users may find it simpler if table filters are always global. Maybe I missed something, but implementation wise, this could actually make things more complicated. We'd need to check chart types when saving dashboard metadata, which doesn't seem easy to pass around for Given that all charts will have a global scope by default, I wonder how much benefits it adds to make such a distinction. |
|
@mistercrunch @bolkedebruin Dashboard's filter_box filter had added a lot new features during last year (#8404, #7908, #8166, #7642). Want to hear your feedback about what functionalities should table filter offer? |
|
This issue has been automatically marked as stale because it has not had recent activity. It will be closed if no further activity occurs. Thank you for your contributions. For admin, please label this issue |
|
can we merge this? |
|
This issue has been automatically marked as stale because it has not had recent activity. It will be closed if no further activity occurs. Thank you for your contributions. For admin, please label this issue |
|
Supersedes by #11814 and its followups. |
|
Hi to everyone! I'm new in Superset and I want to use this feature. My question is simple. Where should I put this |
|
@nikoszagk this feature is not yet available, but is being actively worked on right now. We expect it to become available fairly soon (=within a few months) |
|
@nikoszagk here's an example of current work going on in this area: #13178 |
|
Oh, this is a useful function and it would be great. Although, is there any chart table of that, I can click on specific data and filter some other charts? |
|
@nikolagigic you can checkout progress in our public project board https://github.com/apache/superset/projects/27 |
CATEGORY
SUMMARY
"Emit filter events" on table and deck.gl chart has been broken since the introduction of scoped filters. This PR tries to re-enable it by:
table_filter == TRUEas the same as FilterBox in many places.Must wait for the accompanying
superet-uiPR: apache-superset/superset-ui#344Fixes #8273 #8683 .
BEFORE/AFTER SCREENSHOTS OR ANIMATED GIF
Clicking on non-metric table cells should trigger a filter update:
lightcyanis the selected filter.lightorangeis the hover state.Users can edit the scopes of a table chart with filter events in the dashboard's filter scope editor:
TEST PLAN
ADDITIONAL INFORMATION
REVIEWERS
@graceguo-supercat @kristw @etr2460 @williaster