fix: re-enable table filter #9593
There are no files selected for viewing
| Original file line number | Diff line number | Diff line change |
|---|---|---|
|
|
@@ -18,12 +18,29 @@ | |
| */ | ||
| /* eslint-disable camelcase */ | ||
| import { TIME_FILTER_MAP } from '../../visualizations/FilterBox/FilterBox'; | ||
| import { TIME_FILTER_LABELS } from '../../explore/constants'; | ||
|
|
||
| /** | ||
| * Parse filters for Table chart. All non-metric columns are considered | ||
| * filterable values. | ||
| */ | ||
| function getFilterConfigsFromTableChart(form_data = {}) { | ||
| const { groupby = [], all_columns = [] } = form_data; | ||
| const configs = { columns: {}, labels: {} }; | ||
| // `groupby` is from GROUP BY mode (aggregations) | ||
| // `all_columns` is from NOT GROUP BY mode (raw records) | ||
| const columns = groupby.concat(all_columns); | ||
| columns.forEach(column => { | ||
| configs.columns[column] = undefined; | ||
| configs.labels[column] = column; | ||
| }); | ||
| return configs; | ||
| } | ||
|
|
||
| /** | ||
| * Parse filter configs for FilterBox. | ||
| */ | ||
| function getFilterConfigsFromFilterBox(form_data = {}) { | ||
| const { | ||
| date_filter, | ||
| filter_configs = [], | ||
|
|
@@ -32,83 +49,56 @@ export default function getFilterConfigsFromFormdata(form_data = {}) { | |
| show_sqla_time_column, | ||
| show_sqla_time_granularity, | ||
| } = form_data; | ||
| const configs = { columns: {}, labels: {} }; | ||
|
|
||
| filter_configs.forEach(({ column, label, defaultValue, multiple, vals }) => { | ||
| // treat empty string as undefined, too | ||
| const defaultValues = | ||
| multiple && defaultValue ? defaultValue.split(';') : defaultValue; | ||
| configs.columns[column] = vals || defaultValues; | ||
| configs.labels[column] = label; | ||
| }); | ||
|
|
||
| if (date_filter) { | ||
|
There was a problem hiding this comment.
There was a problem hiding this comment. I feel everyday in the internet there will someone claim one or another new theory...🤷♀️ There was a problem hiding this comment. Reduce code is often very difficult to read and plain old for loops or forEach functions are almost always easier to understand. Programs should favor simplicity and clarity, not succinctness. This guy works for Google and is in charge of promoting new browser features such as Service Workers. There was a problem hiding this comment. @ktmud Realize this is old, but wanted to add my 2cents. Performance considerations aside, I find reduce to frequently be faster to write and more readable than for loops and forEach. The key reasons being that I can cognitively follow the steps in sequence by knowing the goal is to turn A into Z, which means somewhere along the chain, I must take that step to go from A to C. As soon as that becomes imperative, I lose the ability to follow it sequentially since variables, intermediary steps, etc. must be declared up front. This leads me to have to make assumptions about what the purpose of the code is to understand the context of what I'm looking at. In a similar vein, that's why I typically hate non-curried underscore / lodash, because it reverses the call order and makes you start at the innermost function call. That being said, the real reason why we write code that way is to have the ability to write it to pause / resume execution at any point in the chain (i.e. generators). There was a problem hiding this comment. Interestingly, I find reduce harder to read also because I was not able to follow it sequentially. It kind of places the input and output in a very twisted flow: input.reduce((intermediateOutput, input) => {
return intermediateOutput
}, output);Maybe I just didn't use it often enough, but every time I encounter a reduce function, I always have to think what the output look like and sometimes it could even be difficult to find where the output object was initialized. For this specific case, the original code looks like this: const updatedLabels = {
...configs.labels,
...Object.entries(TIME_FILTER_MAP).reduce(
(map, [key, value]) => ({
...map,
[value]: TIME_FILTER_LABELS[key],
}),
{},
),
};
configs.labels = updatedLabels;Without reduce, it's just: Object.entries(TIME_FILTER_MAP).forEach(([key, column]) => {
configs.labels[column] = TIME_FILTER_LABELS[key];
});Is reduce really faster to write and read? |
||
| configs.columns[TIME_FILTER_MAP.time_range] = form_data.time_range; | ||
| // a map from frontend enum key to backend column | ||
| Object.entries(TIME_FILTER_MAP).forEach(([key, column]) => { | ||
| configs.labels[column] = TIME_FILTER_LABELS[key]; | ||
| }); | ||
| if (show_sqla_time_granularity) { | ||
| configs.columns[TIME_FILTER_MAP.time_grain_sqla] = | ||
| form_data.time_grain_sqla; | ||
| } | ||
| if (show_sqla_time_column) { | ||
| configs.columns[TIME_FILTER_MAP.granularity_sqla] = | ||
| form_data.granularity_sqla; | ||
| } | ||
| if (show_druid_time_granularity) { | ||
| configs.columns[TIME_FILTER_MAP.granularity] = form_data.granularity; | ||
| } | ||
| if (show_druid_time_origin) { | ||
| configs.columns[TIME_FILTER_MAP.druid_time_origin] = | ||
| form_data.druid_time_origin; | ||
| } | ||
| } | ||
| return configs; | ||
| } | ||
|
|
||
| export default function getFilterConfigsFromFormdata( | ||
| form_data = {}, | ||
| filters = undefined, | ||
| ) { | ||
| const configs = form_data.table_filter | ||
| ? getFilterConfigsFromTableChart(form_data) | ||
| : getFilterConfigsFromFilterBox(form_data); | ||
|
|
||
| // if current chart has preselected filters, update it | ||
| if (filters) { | ||
|
There was a problem hiding this comment. this function There was a problem hiding this comment. Hmm, I don’t think this is actually in use. It comes from my previous attempt with some larger refactoring, which didn’t work out in the end. Will clean this up. |
||
| Object.keys(filters).forEach(column => { | ||
| if (column in configs.columns && filters[column]) { | ||
| configs.columns[column] = filters[column]; | ||
| } | ||
| }); | ||
| } | ||
| return configs; | ||
| } | ||
| Original file line number | Diff line number | Diff line change |
|---|---|---|
| @@ -0,0 +1,31 @@ | ||
| /** | ||
| * Licensed to the Apache Software Foundation (ASF) under one | ||
| * or more contributor license agreements. See the NOTICE file | ||
| * distributed with this work for additional information | ||
| * regarding copyright ownership. The ASF licenses this file | ||
| * to you under the Apache License, Version 2.0 (the | ||
| * "License"); you may not use this file except in compliance | ||
| * with the License. You may obtain a copy of the License at | ||
| * | ||
| * http://www.apache.org/licenses/LICENSE-2.0 | ||
| * | ||
| * Unless required by applicable law or agreed to in writing, | ||
| * software distributed under the License is distributed on an | ||
| * "AS IS" BASIS, WITHOUT WARRANTIES OR CONDITIONS OF ANY | ||
| * KIND, either express or implied. See the License for the | ||
| * specific language governing permissions and limitations | ||
| * under the License. | ||
| */ | ||
| /* eslint-disable camelcase */ | ||
|
|
||
| /** | ||
| * Check if a chart is one of the filter chart types, i.e., FilterBox | ||
| * and any charts with `table_filter = TRUE`. | ||
|
There was a problem hiding this comment. Even the chart is not a There was a problem hiding this comment. Yes. That was how table filter was originally implemented. I think it’s probably OK. Tableau also has this feature where you can filter/highlight by categorical values from linked charts. There was a problem hiding this comment. but in the code you only have There was a problem hiding this comment. For now. But the design should account for generic cases, which is why I proposed to change “table_filter” to a more generic name. Current implementation also tightly couple viz type with the filters, which kind of goes against our goal of making visualizations more pluggable. But we can deal with that one at a time. |
||
| * | ||
| * TODO: change `table_filter` to a more generic name. | ||
| */ | ||
| export default function isFilterChart(slice) { | ||
| const { form_data = {} } = slice; | ||
| const vizType = slice.viz_type || form_data.viz_type; | ||
| return vizType === 'filter_box' || !!form_data.table_filter; | ||
| } | ||
There was a problem hiding this comment.
Choose a reason for hiding this comment
The reason will be displayed to describe this comment to others. Learn more.
would
nullbe better here? seems like that might match the filterbox empty value? to me that's more an explicit "undefined" versusundefinedThere was a problem hiding this comment.
Choose a reason for hiding this comment
The reason will be displayed to describe this comment to others. Learn more.
To me,
nullmeans users specifically choose an empty value for the filter.undefinedis more like the "data not yet available" default.In
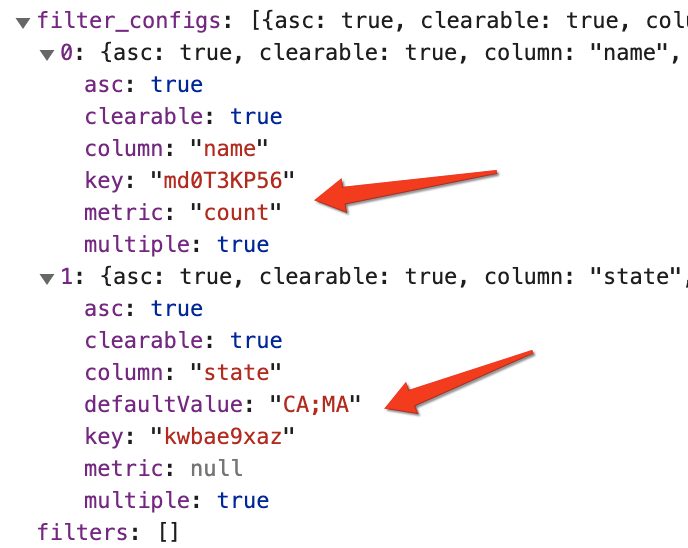
FilterBox, thedefaultValueis alsoundefined, notnull:Since there is no way to set a default filter for table charts, using
undefinedto indicate "not set" seems more appropriate to me.