-
-
Notifications
You must be signed in to change notification settings - Fork 3.6k
New issue
Have a question about this project? Sign up for a free GitHub account to open an issue and contact its maintainers and the community.
By clicking “Sign up for GitHub”, you agree to our terms of service and privacy statement. We’ll occasionally send you account related emails.
Already on GitHub? Sign in to your account
Disable trace level tracing by default via a Cargo feature #7223
Conversation
| "hdr", | ||
| "png", | ||
| "release_max_level_debug", |
There was a problem hiding this comment.
Choose a reason for hiding this comment
The reason will be displayed to describe this comment to others. Learn more.
this line is the real change, the rest was just alpha-sorting the list.
There was a problem hiding this comment.
Choose a reason for hiding this comment
The reason will be displayed to describe this comment to others. Learn more.
Why is that not just called trace or tracing and left out of default features? Negative features are strongly discouraged by cargo itself; all features should be additive.
There was a problem hiding this comment.
Choose a reason for hiding this comment
The reason will be displayed to describe this comment to others. Learn more.
This is a huge performance improvement. Really nice job finding this!
However, this approach does have issues where we generally advise users to compile their dependencies in release mode to improve development time performance. Users will have a harder time debugging rendering operations involved without disabling the default features.
Marking this as controversial since this impacts the entire engine.
|
Agreed it's a pretty big change. I'm also being open to being more tactical - there's probably < 10 callsites that should slap a |
|
is this a reversal of #4580? if so, we should still add the feature to the stress test examples (at least) using the strategy outlined in that pr
|
|
This is a reversal of #4580 in spirit - it re-enables compile-time suppression of trace! (but not debug!) logs. Rather than unconditionally setting By default, |
|
I think I agree that having |
|
@james7132 wouldn't the feature only affect our usage of tracing and not also dependencies? |
features are additive so i'm pretty sure it would apply to the whole app (unless users/deps use a different version of tracing or something). it definitely used to suppress user logging before #4580. i personally think being welcoming to newcomers (i.e. not silently supressing their logs by default) is more important than squeezing out every last fps by default (especially since squeezing fps requires other actions like setting lto anyway). |
Only the |
@danchia if that's the case, can we just put the trace! macros behind a |
That would mean it would not be possible to have spans on a release build. The perf impact of those was known (and maybe forgotten), that's one of the reason I have a feature for release in my games that enable I think I would be in favor of how this PR works, a default feature |
|
Quick clarifications
Options:
Personally, I think both (3) and (2) are acceptable, but being new to Bevy I don't know how to weigh the options. I would be happy to raise a new PR for (2) if that's what is deemed preferable. |
|
I just discovered that The log crate is more prescriptive (https://docs.rs/log/latest/log/#compile-time-filters)
I do think that our usage of a feature makes it a little more palatable - users have a way to opt out, in contrast to what we did pre #4580. That said, given that multiple crates / libraries suffer from this, option (2) is looking a bit more tempting, together with performance guidance for end users around LTO, and |
|
My opinion, I believe, is that many people are more likely to miss this feature and so leave performance on the table unnecessarily than are to miss logs/traces at a higher level than debug. I think it is a good thing that the performance hit is also removed from dependencies such as wgpu. If people need trace-level logging they can find out how to make it work or run debug because that level of verbosity is going to anyway slow down execution. @cart what do you think about this PR? |
|
It would be very surprising to me to see that bevy disables emitting There is however one option I have not seen mentioned in this thread:
This way it's an opt-in feature that people who are debugging something close to this can find and enable, while also not overloading any existing mechanism. |
|
Sounds like we need to balance the following:
I consider the combination of (1) and (6) to be the dominating priority here. Users must have some way to view their trace logs. If it works by default, awesome. But bad performance in default release builds affects Bevy app developers' experience, the experience of their users, and the overall perception of Bevy's quality as an engine. If (3) was our only problem, I think using one or more bevy-specific non-default tracing features would be the move. As long as we stay principled, we get (1) and (2) with no downside. Unfortunately (4) is also a problem. It is almost entirely out of our control, and I think it is likely to get worse over time. It would be interesting to see how much perf we'd currently leave on the table if we leave trace logs enabled/compiled in by default (ex: wgpu still does trace logs), but we disable our own trace logs with a feature flag. But even if that loss is acceptable now, it feels scary that one of our dependencies might one day do a patch release that adds a new trace log that immediately tanks everyone's performance by default. We have no levers to pull other than disabling trace logging unconditionally. I'm currently biased toward the opinionated "trace-level logging is disabled by default in bevy" approach. It protects us, our users, and our users' users from this problem unconditionally now and forever. People that want tracing (a comparatively small / advanced group of users) can disable default features. However going the "non-default" route is currently non-trivial, as it means users need to learn exactly what features to enable ... we should investigate ways to make expressing However if we can prove that we currently aren't leaving too much perf on the table with the "put bevy trace logs behind a non-default feature flag" approach (ex: wgpu isn't too expensive), then I could be convinced to table the problem until it becomes a bigger issue. But it feels like this will be a problem eventually. The number of traces in our dependencies is unbounded. Ditto for 3rd party Bevy plugins. |
|
@cart this PR doesn't include it – was waiting on direction to stabilize – but this writeup I did covers the impact of adding Spoiler: 2X speedup in |
I disagree on this one. We should educate Bevy users in how to disable default features and only add the one they want. For performances and build time. I hope the editor will be very helpful on that point... |
Yeah "Bevy Editor as a visual feature manager, maybe facilitated by bevy_cli" does seem reasonable to me and would make this all more accessible. And I agree that enabling / disabling features provides tangible benefits. But I still think as it stands with normal cargo builds saying this to the average user (especially new ones) is untenable: "you should disable default features, then learn what all 18 default features do, pick the ones you want, and don't forget that new releases will add new default features, so if you try to follow a tutorial and you can't find a symbol it might not be a typo: make sure we didn't add a new feature or you didn't forget to include an existing one". The |
|
I disagree on the whole "tracing should be enabled by default, users except Now, independently, we could also look at why those checks are expensive. 140ms of checking a trace level is unexpected and prohibitive. The check should be branch-predicted fairly correctly, so should have almost zero impact. This looks like an issue not only for regular builds, but even for profiling ones if 2/3rd of the time is spent in profiling-related code, because then we're not measuring the app we're profiling the profiling code itself. A rule of thumb is that profiling overhead should be in the 5-10% range at most, and ideally even around 1-2% only. |
|
Revisiting this as it was raised on Discord. I hadn’t seen @cart ’s message but I was going to come here and say ‘how about adding a default feature that disables trace level logs/spans and in that way people can configure it if they want/need to.’ @djeedai it’s not just about profiling as far as I understand. The trace log level is for super-verbose debug logs that have nothing to do with profiling. Your point about the overhead of instrumentation for the purpose of profiling is very relevant. In practice we only add spans around systems/command application/overhead at the most granular at the moment. However, the trace logs that we added in the TrackedRenderPass are per binding/draw command which are maybe 6 or so instances per visible mesh entity for 3D. |
|
I've given this a bit more thought. I think we've largely come to the conclusion that disabling tracing by default would be reasonable behavior for bevy on its own. However ... I personally think asking people to type out In the immediate short term, given that wgpu's tracing is the biggest offender, I think we should reach out to the wgpu folks and ask them if they'd be willing to put these logs behind a feature flag (non-default would be preferable I think, but thats not critical). This issue affects their users too ... I bet a good portion of their users are deploying slower-than-necessary release builds as a result. That fixes the immediate (very nasty) problem and buys us time to solve this problem more globally (if we decide that is still necessary). @cwfitzgerald: any thoughts on this? |
|
Definitely file an issue about it - we've already been in discussion about adjusting our logging. I've never seen it in profiles, but if it's really 2x range, we definitely want to consider it. |
|
Closing in favor of the approach in #7639. I will reach out to wgpu about their logging. |
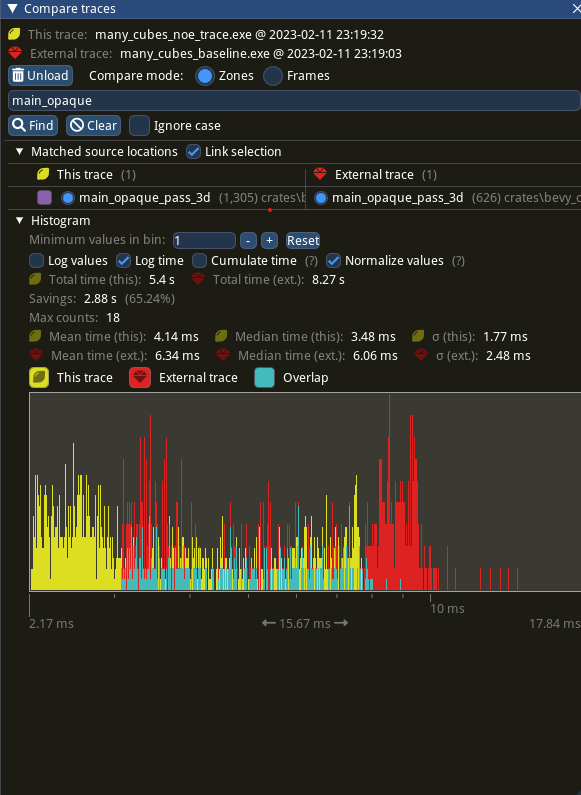
Profiles show that in extremely hot loops, like the draw loops in the renderer, invoking the trace! macro has noticeable overhead, even if the trace log level is not enabled. Solve this by introduce a 'wrapper' detailed_trace macro around trace, that wraps the trace! log statement in a trivially false if statement unless a cargo feature is enabled # Objective - Eliminate significant overhead observed with trace-level logging in render hot loops, even when trace log level is not enabled. - This is an alternative solution to the one proposed in #7223 ## Solution - Introduce a wrapper around the `trace!` macro called `detailed_trace!`. This macro wraps the `trace!` macro with an if statement that is conditional on a new cargo feature, `detailed_trace`. When the feature is not enabled (the default), then the if statement is trivially false and should be optimized away at compile time. - Convert the observed hot occurrences of trace logging in `TrackedRenderPass` with this new macro. Testing the results of ``` cargo run --profile stress-test --features bevy/trace_tracy --example many_cubes -- spheres ```  shows significant improvement of the `main_opaque_pass_3d` of the renderer, a median time decrease from 6.0ms to 3.5ms. --- ## Changelog - For performance reasons, some detailed renderer trace logs now require the use of cargo feature `detailed_trace` in addition to setting the log level to `TRACE` in order to be shown. ## Migration Guide - Some detailed bevy trace events now require the use of the cargo feature `detailed_trace` in addition to enabling `TRACE` level logging to view. Should you wish to see these logs, please compile your code with the bevy feature `detailed_trace`. Currently, the only logs that are affected are the renderer logs pertaining to `TrackedRenderPass` functions
…7639) Profiles show that in extremely hot loops, like the draw loops in the renderer, invoking the trace! macro has noticeable overhead, even if the trace log level is not enabled. Solve this by introduce a 'wrapper' detailed_trace macro around trace, that wraps the trace! log statement in a trivially false if statement unless a cargo feature is enabled # Objective - Eliminate significant overhead observed with trace-level logging in render hot loops, even when trace log level is not enabled. - This is an alternative solution to the one proposed in bevyengine#7223 ## Solution - Introduce a wrapper around the `trace!` macro called `detailed_trace!`. This macro wraps the `trace!` macro with an if statement that is conditional on a new cargo feature, `detailed_trace`. When the feature is not enabled (the default), then the if statement is trivially false and should be optimized away at compile time. - Convert the observed hot occurrences of trace logging in `TrackedRenderPass` with this new macro. Testing the results of ``` cargo run --profile stress-test --features bevy/trace_tracy --example many_cubes -- spheres ```  shows significant improvement of the `main_opaque_pass_3d` of the renderer, a median time decrease from 6.0ms to 3.5ms. --- ## Changelog - For performance reasons, some detailed renderer trace logs now require the use of cargo feature `detailed_trace` in addition to setting the log level to `TRACE` in order to be shown. ## Migration Guide - Some detailed bevy trace events now require the use of the cargo feature `detailed_trace` in addition to enabling `TRACE` level logging to view. Should you wish to see these logs, please compile your code with the bevy feature `detailed_trace`. Currently, the only logs that are affected are the renderer logs pertaining to `TrackedRenderPass` functions
…7639) Profiles show that in extremely hot loops, like the draw loops in the renderer, invoking the trace! macro has noticeable overhead, even if the trace log level is not enabled. Solve this by introduce a 'wrapper' detailed_trace macro around trace, that wraps the trace! log statement in a trivially false if statement unless a cargo feature is enabled # Objective - Eliminate significant overhead observed with trace-level logging in render hot loops, even when trace log level is not enabled. - This is an alternative solution to the one proposed in bevyengine#7223 ## Solution - Introduce a wrapper around the `trace!` macro called `detailed_trace!`. This macro wraps the `trace!` macro with an if statement that is conditional on a new cargo feature, `detailed_trace`. When the feature is not enabled (the default), then the if statement is trivially false and should be optimized away at compile time. - Convert the observed hot occurrences of trace logging in `TrackedRenderPass` with this new macro. Testing the results of ``` cargo run --profile stress-test --features bevy/trace_tracy --example many_cubes -- spheres ```  shows significant improvement of the `main_opaque_pass_3d` of the renderer, a median time decrease from 6.0ms to 3.5ms. --- ## Changelog - For performance reasons, some detailed renderer trace logs now require the use of cargo feature `detailed_trace` in addition to setting the log level to `TRACE` in order to be shown. ## Migration Guide - Some detailed bevy trace events now require the use of the cargo feature `detailed_trace` in addition to enabling `TRACE` level logging to view. Should you wish to see these logs, please compile your code with the bevy feature `detailed_trace`. Currently, the only logs that are affected are the renderer logs pertaining to `TrackedRenderPass` functions


Objective
TrackedRenderPasswhich is called repeatedly in the tight inner loops of the renderer.Using
set_bind_groupas an example, out of ~200ms spent on the function, ~140ms we spent checking if tracing is enabled at the trace level.Solution
release_max_level_debugthat statically disables trace-level tracing, thereby eliminating trace-related overhead.Tracy capture using
this = baseline
external = this PR
show a reduction in the median time for
main_opaque_pass_3drendering from 9.06ms -> 4.44ms, i.e. ~2X speedup.Changelog
Migration Guide
release_max_level_debug.