-
-
Notifications
You must be signed in to change notification settings - Fork 3.8k
New issue
Have a question about this project? Sign up for a free GitHub account to open an issue and contact its maintainers and the community.
By clicking “Sign up for GitHub”, you agree to our terms of service and privacy statement. We’ll occasionally send you account related emails.
Already on GitHub? Sign in to your account
Cache System Tracing Spans #9390
Conversation
There was a problem hiding this comment.
Choose a reason for hiding this comment
The reason will be displayed to describe this comment to others. Learn more.
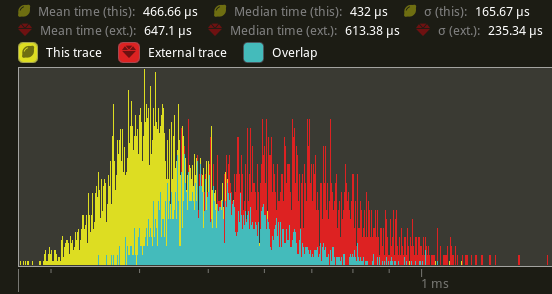
Huzzah for less overhead! The impact is bigger than I expected. LGTM, just a few nits on implementation.
|
Another thought: should we do this for the command application spans too? |
I'll try it. |
|
This is actually getting close to perf with the spans deleted. So it might fix #4892. |
|
Oh nice! |
|
Another, potentially harder, area to check if we can cache spans might be in QueryParIter and friends, but we can leave that to a follow-up PR if need be. |
140b8cc to
3fec176
Compare
|
caching the commands span helped some more:
Probably better to push off to a follow up. I tried to do something quick and reuse the same span for all the tasks, but it ended up running slower. There's probably some contention happening somewhere, so might need to make a separate span for each task. |
95b76aa to
4e5ac92
Compare
|
Example |
|
did something that might be slightly more controversial and moved the system spans into |
4e5ac92 to
79484d8
Compare
|
Example |
There was a problem hiding this comment.
Choose a reason for hiding this comment
The reason will be displayed to describe this comment to others. Learn more.
This is a really nice improvement.
|
I worry there's a trap we're missing here, seems almost too good to be true! Did you check with the tracing dev if there's no issue? That could even be mentioned in their doc. |
|
from this comment #4892 (comment), I assume this is avoiding hitting the registry which they say is the slow thing. |
|
Really simple and nice! |
| let task = task.instrument( | ||
| self.system_task_metadata[system_index] | ||
| .system_task_span | ||
| .clone(), | ||
| ); |
There was a problem hiding this comment.
Choose a reason for hiding this comment
The reason will be displayed to describe this comment to others. Learn more.
This clone makes me wonder, do we really need to instrument the Future as well? Normally this is done because Futures can suspend execution during .await points and that would mess up spans, but here we are never awaiting and moreover we're already measuring the run_unsafe internally, which should account for most of the execution time.
There was a problem hiding this comment.
Choose a reason for hiding this comment
The reason will be displayed to describe this comment to others. Learn more.
The instrumentation here does help measure the additional scheduler overhead, which is thankfully very low right now. However, I do see how this both adds even more profiling overhead and how it might not be all that useful to the typical user. Not sure how to best approach toggling this on or off though.
There was a problem hiding this comment.
Choose a reason for hiding this comment
The reason will be displayed to describe this comment to others. Learn more.
My worry is that the time needed for the instrumentation itself here may be in the same order of magniture as the one it is measuring (in addition to the one already measured inside the run_unsafe). That is, it is measuring how much time is needed to run the catch_unwind, doing a non-blocking send on a channel and checking if the catch_unwind returned an error, all of which are pretty fast.
There was a problem hiding this comment.
Choose a reason for hiding this comment
The reason will be displayed to describe this comment to others. Learn more.
Minor doc could be improved.
| @@ -62,6 +62,9 @@ struct SystemTaskMetadata { | |||
| is_send: bool, | |||
| /// Is `true` if the system is exclusive. | |||
| is_exclusive: bool, | |||
| /// Cached tracing span for system task | |||
There was a problem hiding this comment.
Choose a reason for hiding this comment
The reason will be displayed to describe this comment to others. Learn more.
| /// Cached tracing span for system task | |
| /// Tracing span for system task, cached for performance. |
# Objective We cached system spans in #9390, but another common span seen in most Bevy apps when enabling tracing are Query::par_iter(_mut) related spans. ## Solution Cache them in QueryState. The one downside to this is that we pay for the memory for every Query(State) instantiated, not just those that are used for parallel iteration, but this shouldn't be a significant cost unless the app is creating hundreds of thousands of Query(State)s regularly. ## Metrics Tested against `cargo run --profile stress-test --features trace_tracy --example many_cubes`. Yellow is this PR, red is main. `sync_simple_transforms`:  `check_visibility`:  Full frame: 
# Objective We cached system spans in bevyengine#9390, but another common span seen in most Bevy apps when enabling tracing are Query::par_iter(_mut) related spans. ## Solution Cache them in QueryState. The one downside to this is that we pay for the memory for every Query(State) instantiated, not just those that are used for parallel iteration, but this shouldn't be a significant cost unless the app is creating hundreds of thousands of Query(State)s regularly. ## Metrics Tested against `cargo run --profile stress-test --features trace_tracy --example many_cubes`. Yellow is this PR, red is main. `sync_simple_transforms`:  `check_visibility`:  Full frame: 
# Objective - Reduce the overhead of tracing by caching the system spans. Yellow is this pr. Red is main. 
# Objective We cached system spans in bevyengine#9390, but another common span seen in most Bevy apps when enabling tracing are Query::par_iter(_mut) related spans. ## Solution Cache them in QueryState. The one downside to this is that we pay for the memory for every Query(State) instantiated, not just those that are used for parallel iteration, but this shouldn't be a significant cost unless the app is creating hundreds of thousands of Query(State)s regularly. ## Metrics Tested against `cargo run --profile stress-test --features trace_tracy --example many_cubes`. Yellow is this PR, red is main. `sync_simple_transforms`:  `check_visibility`:  Full frame: 


Objective
Yellow is this pr. Red is main.