Tone is a project that aims to address the challenge of getting an accurate foundation makeup match. The current best method for getting accurately matching foundation makeup is to go to a brick and mortar store and try on different shades. Making matters worse, skin tone and skin needs change throughout the year for many people which means the user will often need to go back to the store if their skin changes.
Tone works to address the core issues by measuring the users skin tone with a mobile app and match them to the best foundation makeup for their needs.
| Repo | |
|---|---|
| Tone Color Match | Primary image processing pipeline. Takes a set of images of the users face (taken by the iOS app) and records the processed colors to the database |
| Tone iOS App | Guides the user through capturing the images, preprocesses them, and sends them to the server |
| Tone Server | RESTful API handling user data, authentication, and beta testing information. Receives images from the iOS app and starts color measuring jobs |
| Tone Spectrum (This Repo) | A deep dive into metamerism as a potential source of error for Tone in its current form |
| Tone Database | SQL |
| Tone SQS | Command line utility for sending SQS messages to the Color Match worker. Good for running updated Color Match versions on old captures |
This project was started after beta testing Tone and noticing that I was not able to achieve the accuracy I was hoping to see. There are a number of reasons that could be causing this but one seemed particulary interesting: Metamerism.
Wikipedia explains metamerism well: "metamerism is a perceived matching of colors with different (nonmatching) spectral power distributions". This makes it hard or impossible to compare two different colors in some lighting conditions. Tone relies mobile device screens as a light source, but screens do not emit a broad or uniform spectrum of light which could make them particularly suseptible to metamerism.
Metamerism is a concept that I suspect shows up in the broader makeup industry as well. Many makeup users report their fustration of having foundation makeup match in the store, but not match when outside. Artifical light sources (e.g. Flourscent store lights) often do no emit a uniform or broad spectrum of light.
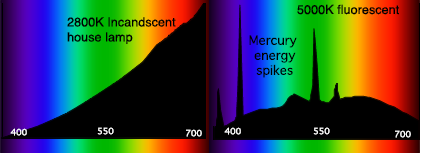
Example of spectral distrubitions of different light sources from wikipedia:

Parital light distribution of device screens is a potential source of error for Tone in two ways:
- Using the same device, a user whose skin tone has changed may get the same result each time
- Two different devices with different screens (each with a different spectral power distribution) may report two skin tones as the same when they should differ, or vice versa
In order to analyze the spectral power distributions of light sources, I need a spectrometer, however, the types of spectrometers that you can read the output from are expensive.
Starting with a basic spectroscope and attaching a cellphone allows me to capture images of the spectral distribution.
NOTE: This whole process is not incredibly accurate, but it should give an indication about whether metemerism could be an influencing factor
A few modifications were required to improve the quality of the images captured:
- Line the spectroscope with felt to reduce internal reflections
- Add a red filter over the number line to reduce the brightness of the numbers and reduce any diffraction caused by the numbers
The images are captured in a raw format to prevent any changes being performed before we start processing.
Unprocessed output from the spectroscope:

These steps are applied in imageToSpectrum.py
- The raw image is loaded
- A crop is automatically applied around the numberline and the light spectrum
- This is done by finding the number line using thresholding in the red color channel
- Once the numbers are found, we know the spectrum is directly beneath
- The color channels are separated out from each other, as shown below
- The gradients from top to bottom are Red, Green, Blue

- In the spectrum, each color channel is converted into a set of (x, y) points, with y representing the magnitude of the channel brightness at that location
- Each column of pixels in the spectrum sample can be averaged to get a sampling for that location
- We can scale the Y-Axis between 0 and 1, and the X-Axis between the starting wavelength and the ending wavelength (taken from numberline)
- Important Note: This is uncalibrated, raw sensor data plotted. It does not tell us all that much yet
- Example of the data, plotted

- The curve is then written to a CSV file along with some metadata to be processed in
virtualCamera.py
These steps are applied in virtualCamera.py and spectrumTools.py
There are a few separate components needed to build the virtual camera
- Light source specular power distribution
- Surface reflectance across the spectrum
- Image sensor spectral sensitivity
Transforming the output from imageToSpectrum.py into a usable, roughly accruate, spectral power distribution takes a few steps:
- Combine the RGB curves into a single curve, simply by adding the spectral sensitivities
- Calibrate the curve using a calibration curve
- The calibration curve is generated by sampling a D65 light source with the spectrometer, and dividing the combined spectral power curve by the expected D65 spectral power curve
- For this project, early afternoon sun was sampled using a white reference card, but this is pretty far from ideal. Any object with a known spectral distribution across the visible spectrum can be used. An incandecent lightbulb could be a good choice.
Examples of a few calibrated spectral power distributions:

- Yellow: Sunlight
- Red: Incandecent Lightbulb
- Green: White IPad LCD Display at full brightness
- Blue: "Full Spectrum" LED Lightbulb
NOTE: In this plot the region of the iPad spectral power distribution contributed to by the green subpixel appears less intense. This is most likely due to the way the Bayer Pattern of pixels was sampled. In the pattern there are two green subpixels for every one red and blue. I only sampled one of the greens per pixel for simplicity.
Surface reflectance for differnt skin tones was sourced from an academic paper. The plot was converted into a vector image, which was then broken out into the individual spectral reflectances and processed into a usable plot.
To calculate the image sensor spectral sensitivity we need to know how the each color channel of the sensor would respond to a uniform spectrum of light. To determine this, we divide each channel of the measured D65 curve by the ground truth D65 curve. This should approximately give us the sensor sensitivity.
After all of the setup is complete virtualizing the camera is straight forward.
To simulate illuminating a surface with a lightsouce, we multiply the the light source spectral power distribution by the surface spectral reflectance. To simulate exposing a sensor to the reflected light, we multiply each sensor RGB spectral sensitivity by the reflected light spectrum and add up each channel. Finally we can scale all the values to the largest channel so the results are all between 0 and 1.
NOTE: This works well for color information but does not preserve brightness data. Future updates should start by addressing this.
Now that we can simulate illuminating various surfaces with different light sources, we want to see what happens when two surfaces that look different under sunlight/full spectrum light are illuminated by another light source. The best way to do this is to calculate the the RGB sensor values for two differnt surfaces under the same lighting condition. Then we we recalculate the RGB sensor values for the same surfaces under a differnt light source (i.e. an iPad screen).
To make it easier to track, I'l refer to these values as RGB_S1_L1, RGB_S2_L1, RGB_S1_L2, RGB_S2_L2. (S for surface and L for light source)
To compare how similar two colors look we can use a perceptual color space like LAB. In LAB the euclidean distance between two colors should approximately correlate to how different those colors look.
| RGB | LAB |
|---|---|
RGB_S1_L1 |
LAB_S1_L1 |
RGB_S2_L1 |
LAB_S2_L1 |
RGB_S1_L2 |
LAB_S1_L2 |
RGB_S2_L2 |
LAB_S2_L2 |
We can compare the distance between the two surfaces under light source 1 and again under light source 2. If the distance decreases, we know it has become harder to tell the surfaces apart, indicating that metamerism may be playing a role.
Distance(LAB_S1_L1, LAB_S2_L1) > Distance(LAB_S1_L2, LAB_S2_L2) -> Possible Metamerism
More work is needed, but in the limited testing it seems that RGB light from a device screen does not make it harder to discern skin tones.
There are a number or places where improvements should be made:
-
Improve the accuracy of the current homemade spectrometer
- Benchmark and improve the resolution of the spectroscope
- The amazon listing claims 5nm, but that seems generous
- Refine the collimating slit to be smaller and more precise
- Calibrate the wavelength scale to a known spectral emission, i.e. helium, or even low pressure sodium vapor street lamps for a free solution
- Generate a more accurate calibration array. Using early afternoon sunlight for a D65 approximate is not incredibly robust... Use a better source. Possibly measure the temperature of a filament in a lightbulb and calibrate to that. Any known spectral power distribution will work.
- (Or just buy a real spectrometer...)
- Benchmark and improve the resolution of the spectroscope
-
Many more human skin tone reflectance curves. Foundation makeup lines often have 40+ shades meaning differentiating between 3 or 4 similar shades may be effected more strongly by metamerism
-
Sample many more light sources, particularly flourencent lights and OLED screens. Sample directly from stores like beauty retailers like Sephora and drugstores like Walgreens
-
An important component that was skipped for this first iteration is preserving the brightness information of the different illuminants. All illuminants were stretched such that their peak spectral power was 1. Adding this back in may make a significant difference in the end results.