-
Notifications
You must be signed in to change notification settings - Fork 1
Incremental View Model Synchronization Using Partial Models
This is the publication page for the paper "Incremental View Model Synchronization Using Partial Models".
The source code is available under the terms of the Eclipse Public License, version 1.0 at https://github.com/FTSRG/viewmodel
Our view transformation approach is fully implemented as an open source project. We carried out an experimental evaluation to address three research questions:
RQ1. What is the complexity of different execution phases in our view transformation engine?
RQ2. What is the performance overhead for the initial run of our view transformation engine compared to reactive imperative transformations with explicit traceability?
RQ3. What is the performance overhead for change-driven behavior of our view transformation engine compared to reactive imperative transformations with explicit traceability?
We selected two substantially different view transformation challenges for our investigation.
-
VirtualSwitch is a filtering transformation taken from the VAO'14 paper Query-driven incremental synchronization of view models (see the publication page for details). The implementation of this case study is available in the ViewModel repository.
-
Dependability is an extended version of the case study used in this paper which aims to compose two separate transformations in a way that the target Petri net model is significantly larger than any of the two source models. The implementation of this case study is available in the ViewModel repository.
We believe that these transformations are representative for key practical applications of view transformations: the VirtualSwitch scenario is typical for in traditional view models with information loss while the transformation challenges in the Dependability case are common for the formal analysis of extra-functional properties of systems.
First, we instrumented our ViewModel transformation approach to enable the clear separation of different transformation phases to address RQ1. Then we compare our approach with two different view transformation styles available in VIATRA. These solutions use an explicit traceability model (vs. implicit traceability in our approach) and imperative actions in transformation rules using Java/Xtend (vs. declarative query-based templates). However, differences in query performance can be mitigated to a large extent. (1.a) The source-reactive solution uses exactly the same source queries as our view transformation approach, but rule priorities had to be set carefully. (1.b) The trace-reactive solution uses queries with both source and traceability elements as part of its precondition. Since both the level of compositionality and the properties of the view transformation engine are different in these approaches compared to our view transformation approach, our evaluation may reveal the performance trade-offs of the increased expressiveness of our approach.
Our repository contains an implementation of the transformations in batch ATL and a partial implementation in eMoflon, but the different performance optimizations in those tools would disallow to separate query performance from transformation performance.
To investigate the initial transformation runs RQ2, our measurement setup contains 5 source models of increasing size. For the VirtualSwitch case, the source models were ranging from 25K to 425K elements, while the target models were ranging from 500 to 9K elements. For the Dependability case, the source models ranged 1K to 25K while the target models ranged from 3K to 72K. In each case, we measured the initial time for populating the caches of queries and the execution time of the first transformation, while the load time of source models was excluded. To address RQ1, we measure how much time the different phases of our view transformation approach takes during this initial run.
Table 1. Source model sizes.
| Scale factor | Source objects | Source references | Source attributes |
|---|---|---|---|
| 1 | 1014 | 3955 | 1865 |
| 2 | 2039 | 7958 | 3752 |
| 4 | 4565 | 17842 | 8403 |
| 8 | 12213 | 47810 | 22495 |
| 16 | 25259 | 98926 | 46524 |
| 32 | 49799 | 194960 | 91735 |
| 64 | 101697 | 398278 | 187327 |
| 128 | 207953 | 814472 | 383068 |
| 256 | 425303 | 1665988 | 783457 |
Table 2. Target model sizes.
| Scale factor | Case study | Target objects | Target references | Target attributes |
|---|---|---|---|---|
| 1 | Dependability | 2941 | 7840 | 2354 |
| 2 | Dependability | 5911 | 15760 | 4732 |
| 4 | Dependability | 13171 | 35120 | 10544 |
| 8 | Dependability | 35101 | 93600 | 28096 |
| 16 | Dependability | 72436 | 193160 | 57980 |
| 16 | VirtualSwitch | 495 | 325 | 495 |
| 32 | VirtualSwitch | 1040 | 708 | 1040 |
| 64 | VirtualSwitch | 2060 | 1370 | 2060 |
| 128 | VirtualSwitch | 4249 | 2841 | 4249 |
| 256 | VirtualSwitch | 8761 | 5869 | 8761 |
To investigate the change-driven behavior (RQ3), we first created 10 different elementary changes (modifications of one element) and 5 change mixes containing 100 elementary changes each (with fix ratio between different types of change within each mix).
Change mix (A)~presents a balanced mix of changes, while types of changes in mixes (B) and (C) were selected from those elementary changes that caused longer synchronization times in the Dependability and VirtualSwitch cases, respectively. Mix (D) were selected from changes that caused longer synchronization times in at least one of cases as a compromise between B and C, where changes in (E) caused longer synchronization times in neither.
Table 3. Change mixes.
| Elementary change | Mix (A) | Mix (B) | Mix (C) | Mix (D) | Mix (E) |
|---|---|---|---|---|---|
| Create switch | 10 | 25 | 0 | 12 | 0 |
| Create segment | 10 | 0 | 0 | 0 | 50 |
| Connect track elements | 10 | 0 | 0 | 0 | 50 |
| Disconnect track elements | 10 | 0 | 33 | 16 | 0 |
| Create route | 5 | 25 | 0 | 12 | 0 |
| Remove route | 5 | 5 | 0 | 5 | 0 |
| Add switch to route | 10 | 20 | 0 | 10 | 0 |
| Remove switch from route | 10 | 25 | 0 | 12 | 0 |
| Set switch failed | 15 | 0 | 34 | 17 | 0 |
| Set switch operational | 15 | 0 | 33 | 16 | 0 |
Each experiment was executed 30 times after 10 warmup runs on a cloud-based virtual environment (with 4 CPU, 16 GB memory and 8 GB disk size, m5.xlarge) on Amazon AWS. Heap space of the Java virtual machine was limited to 15 GB.
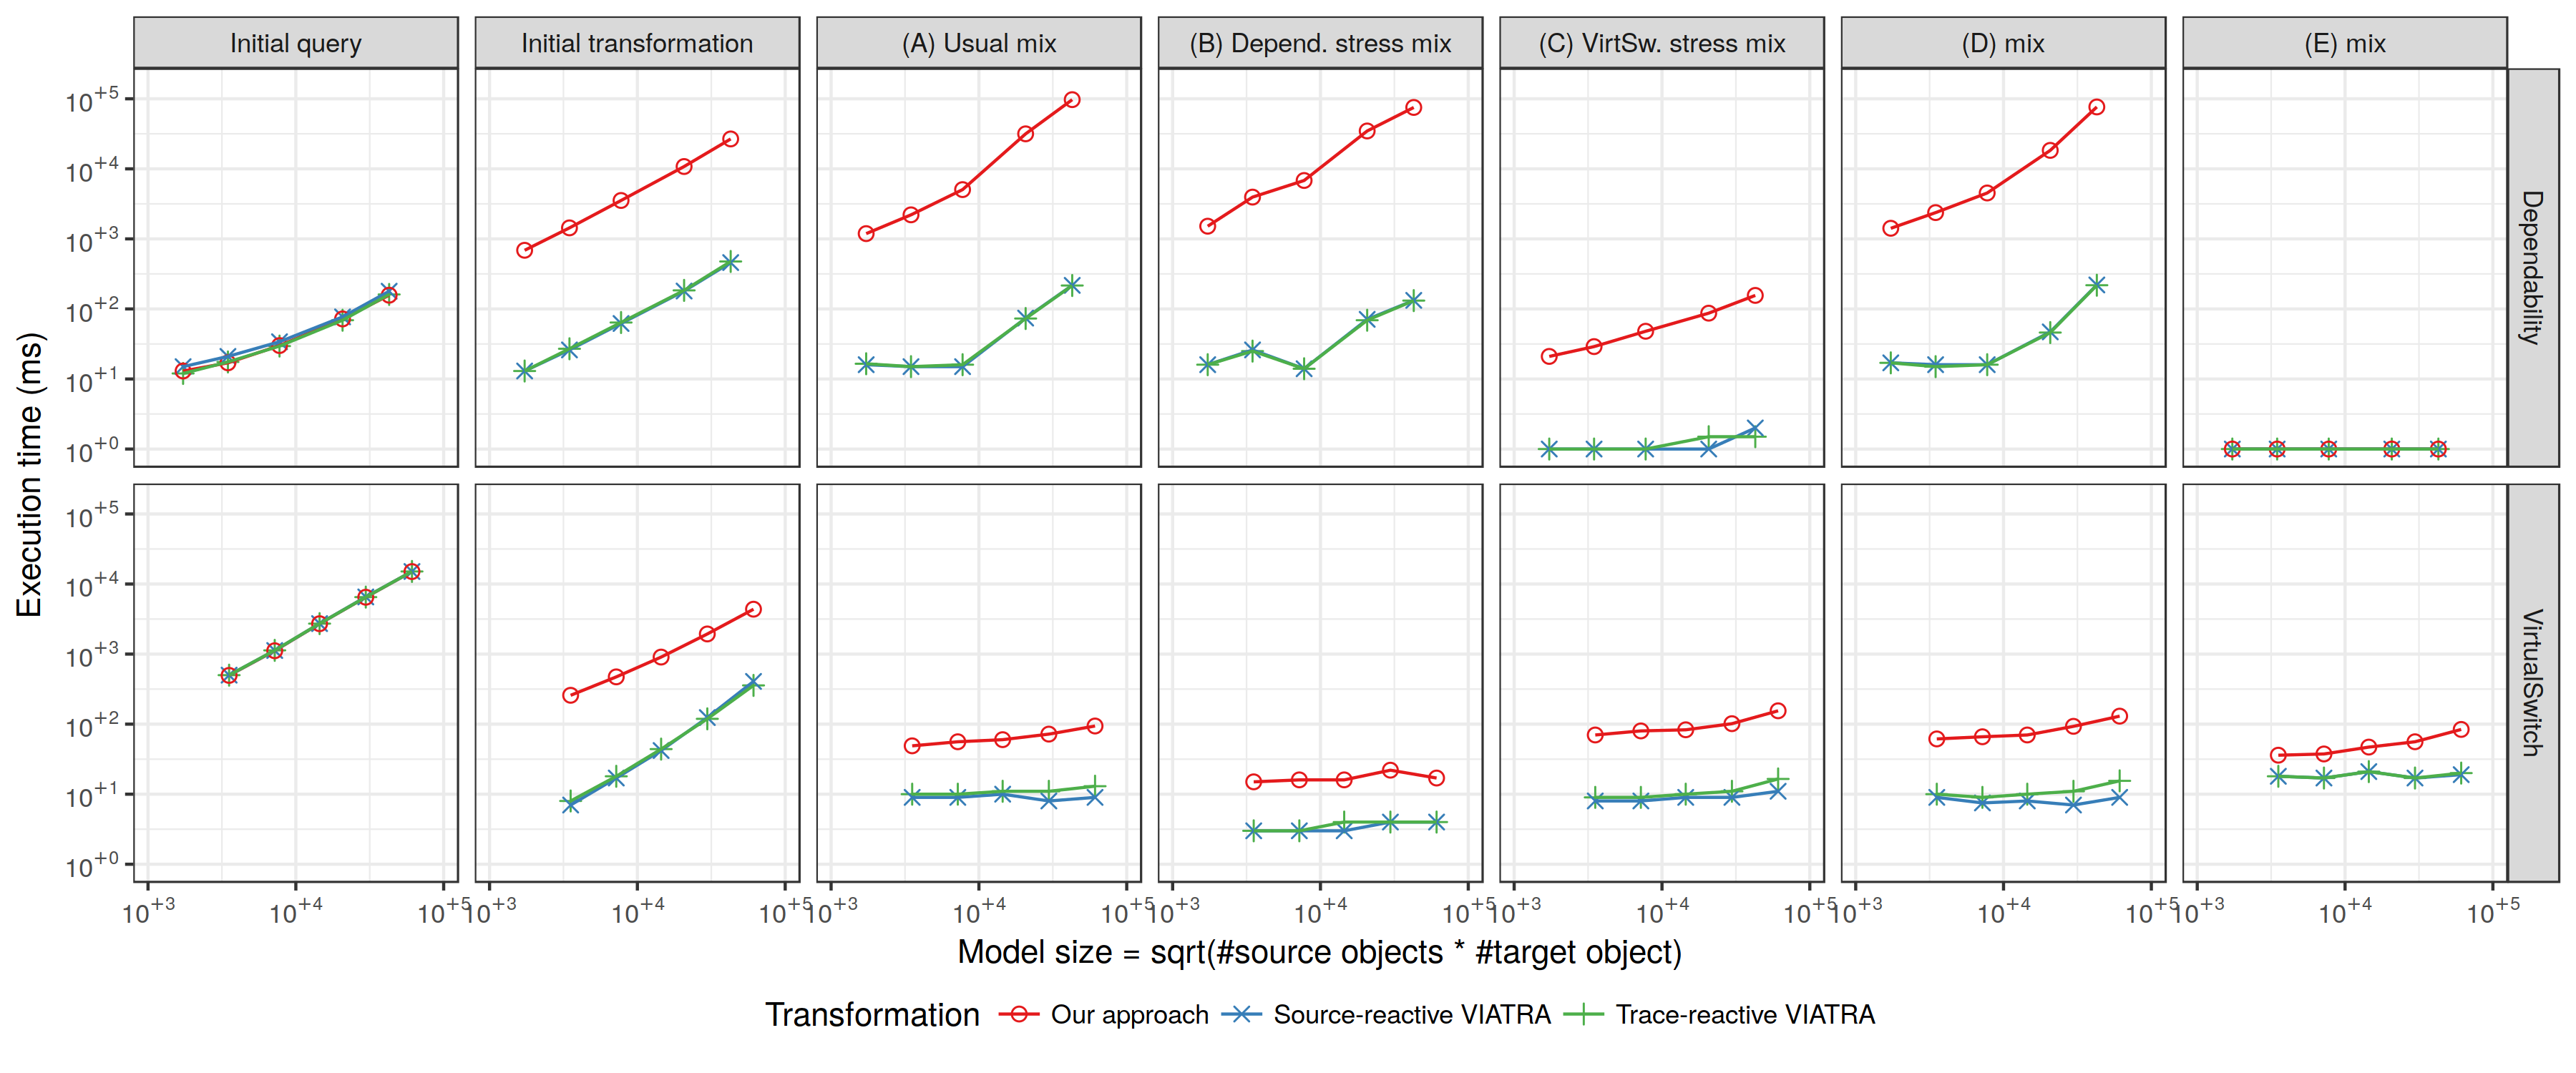
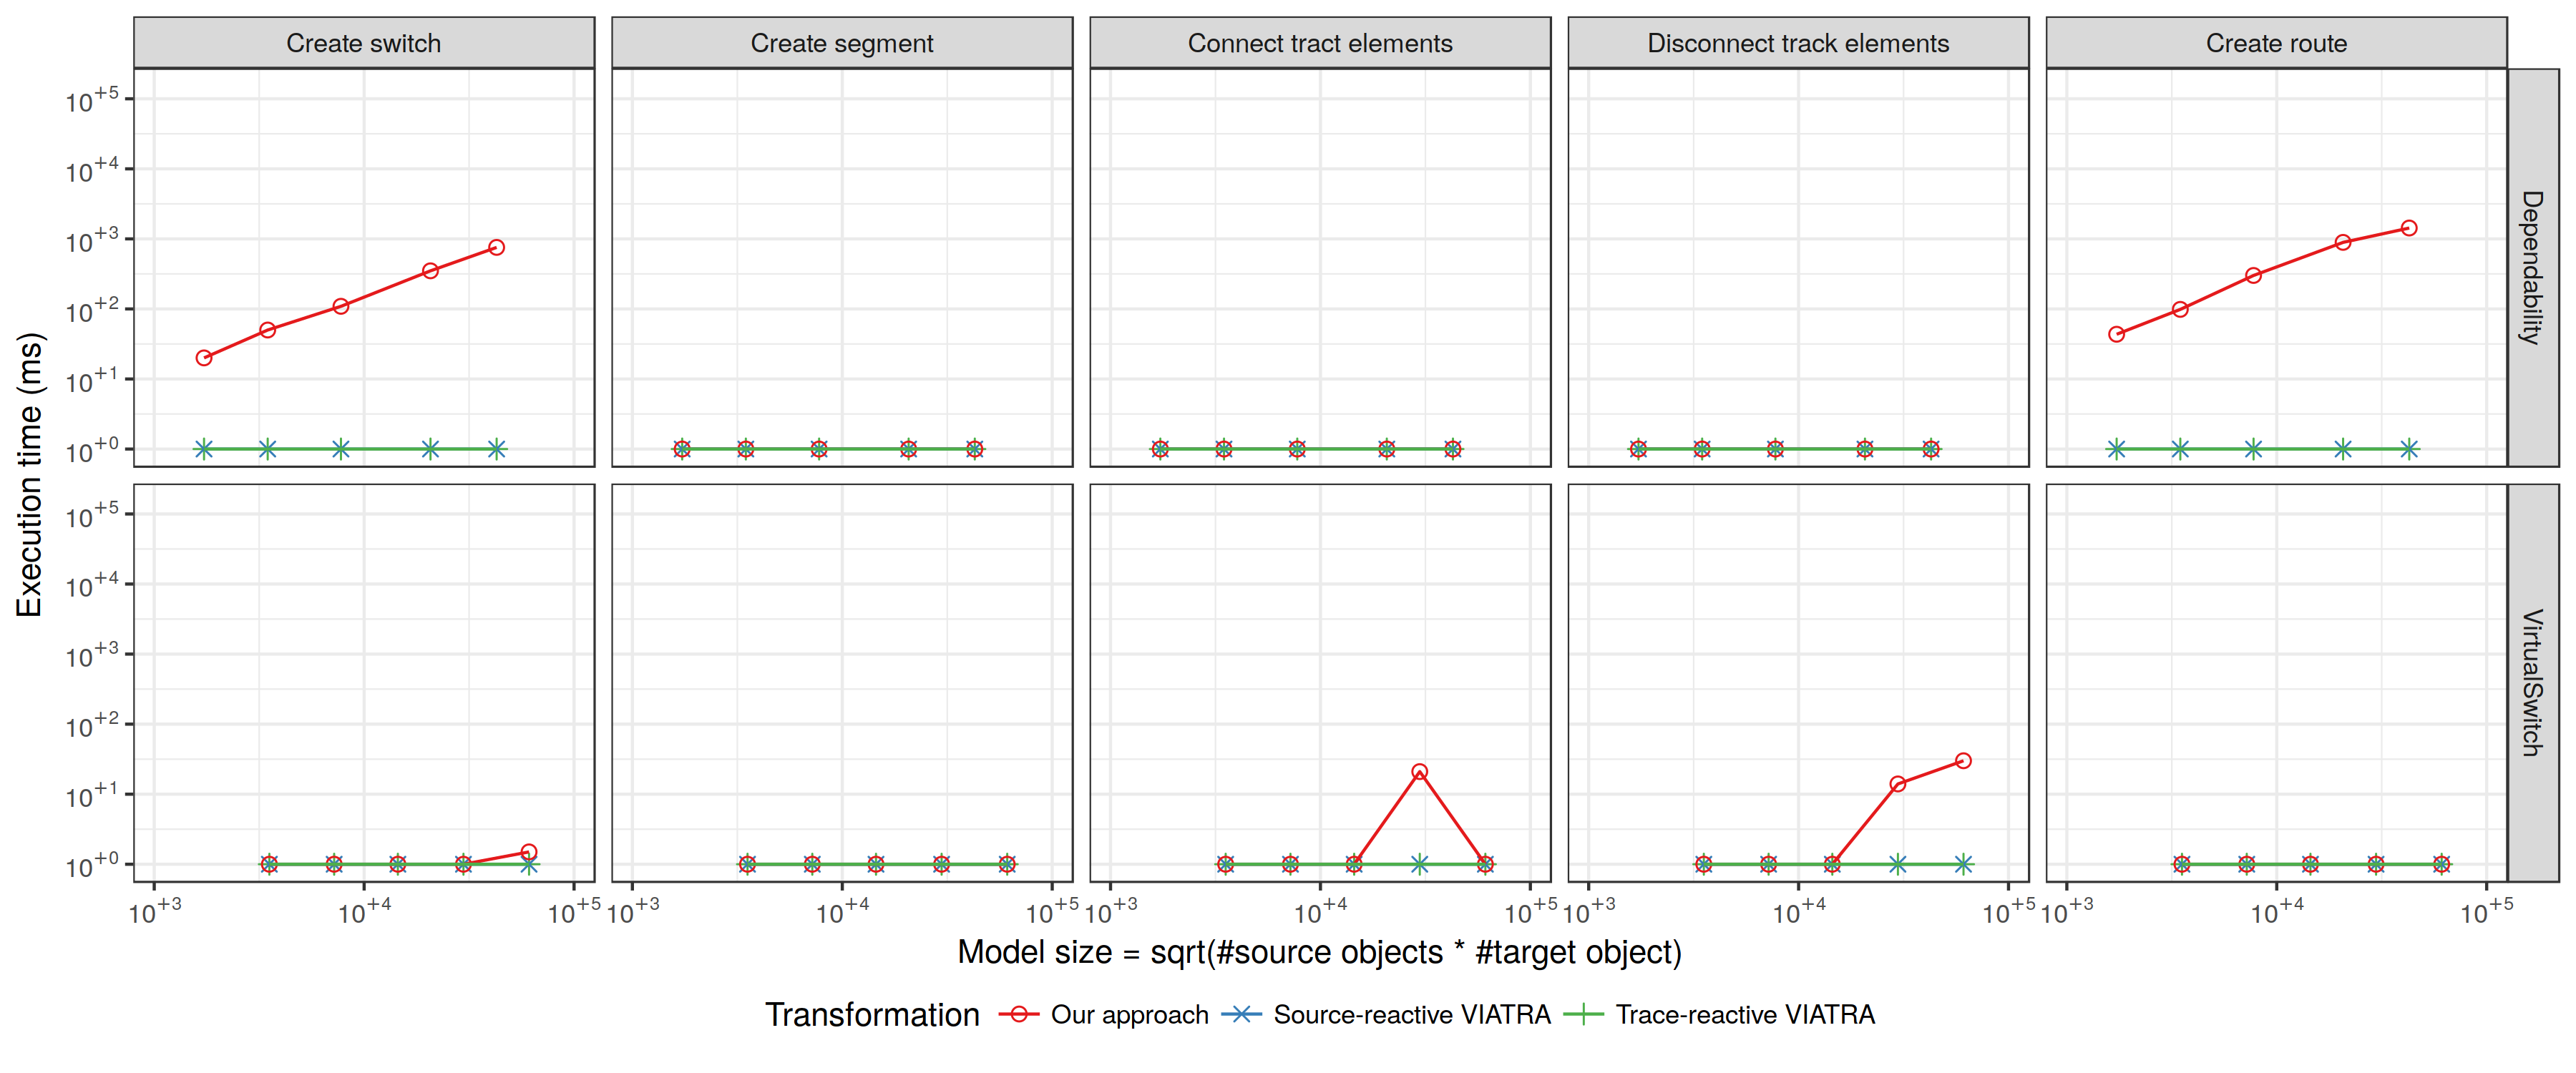
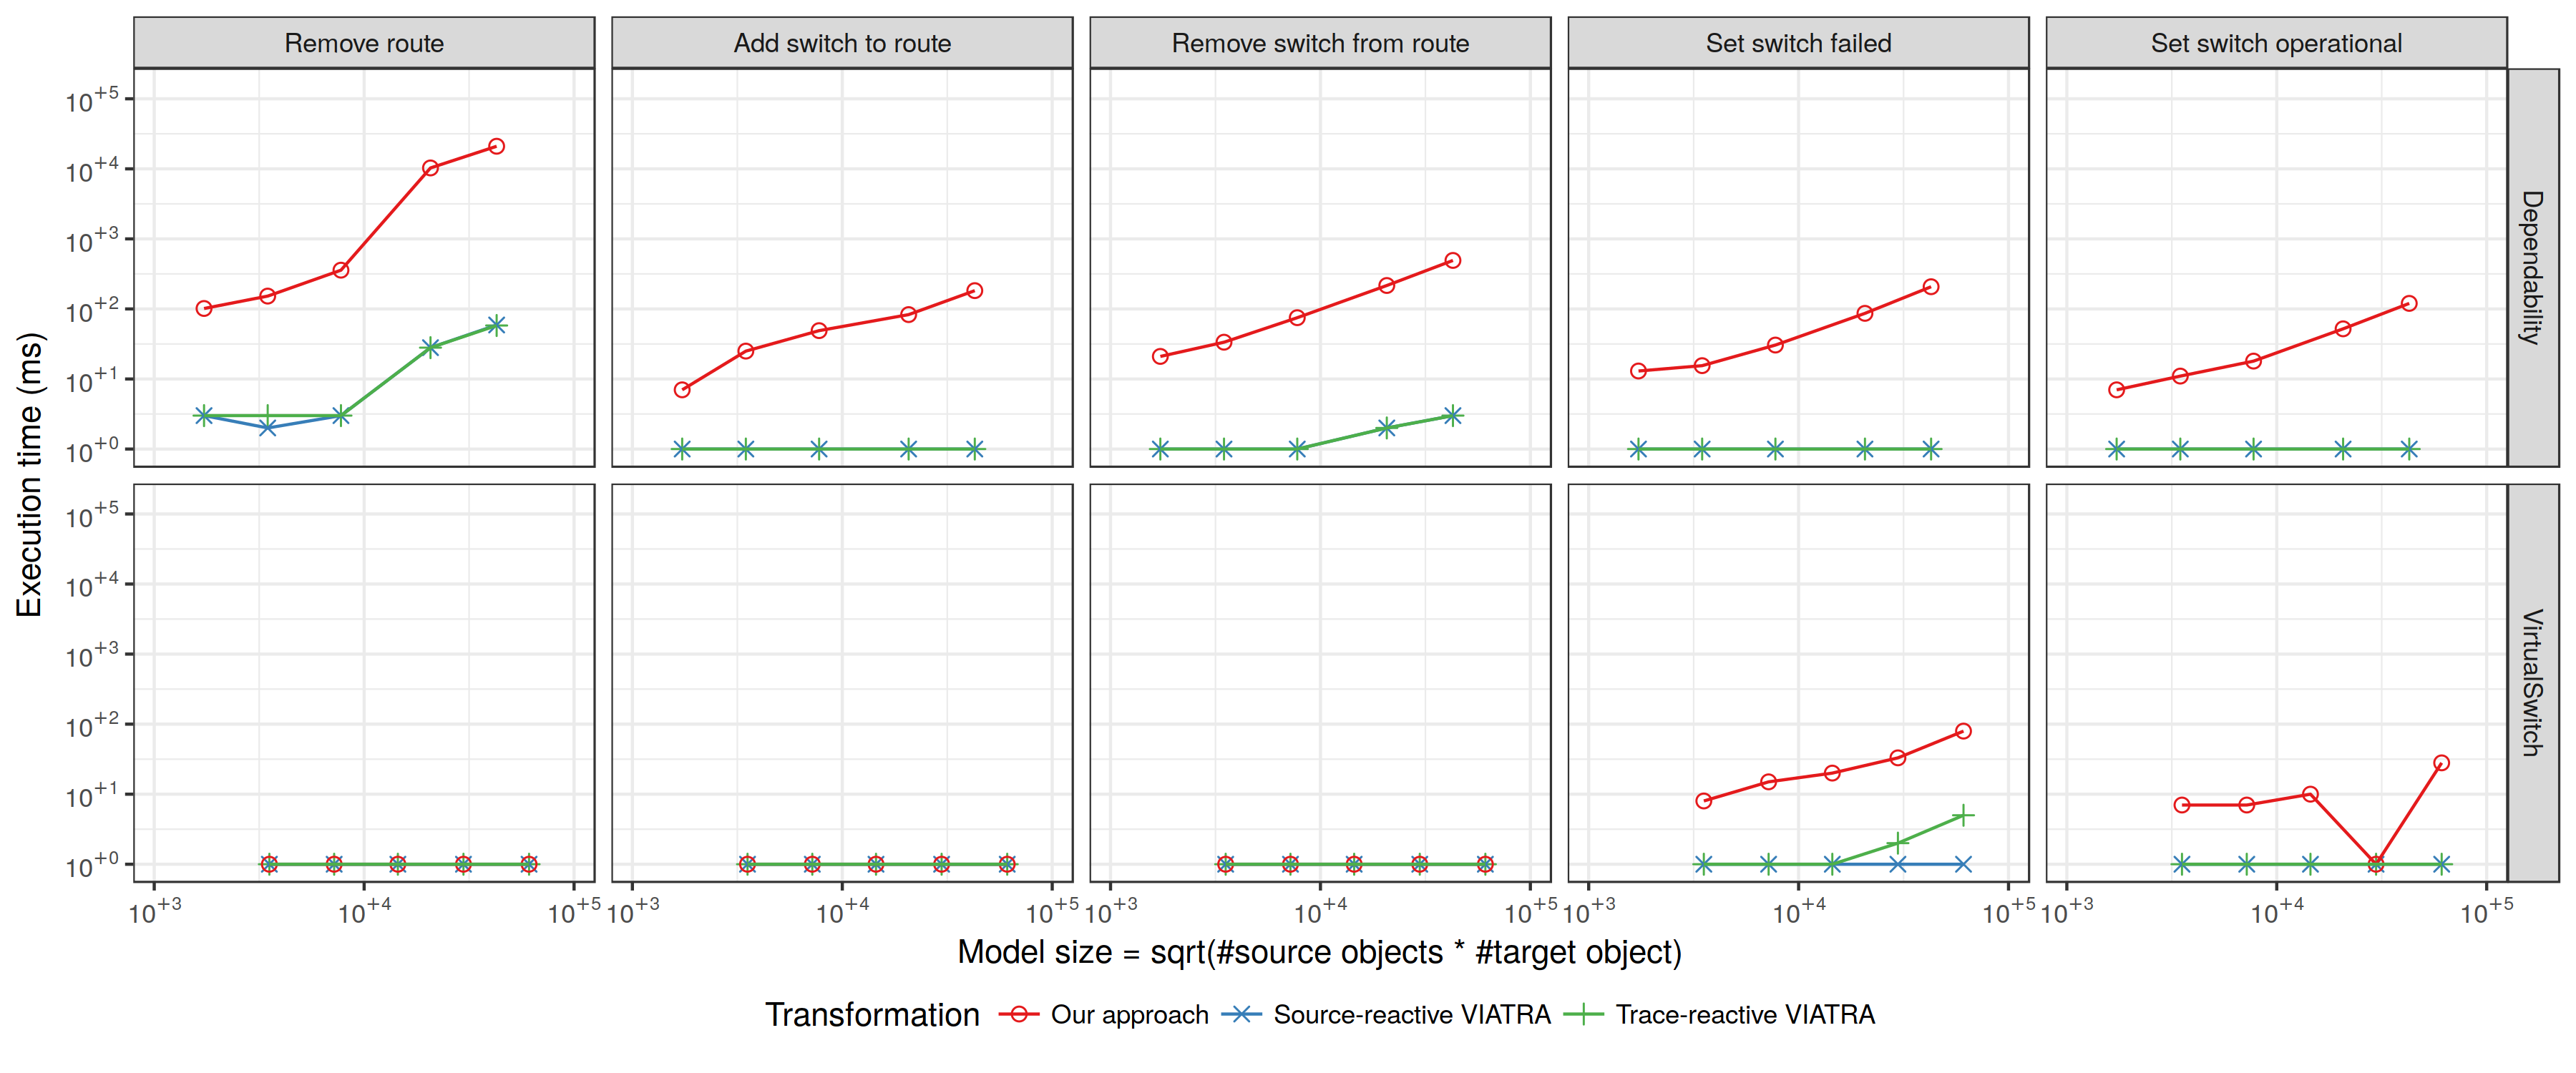
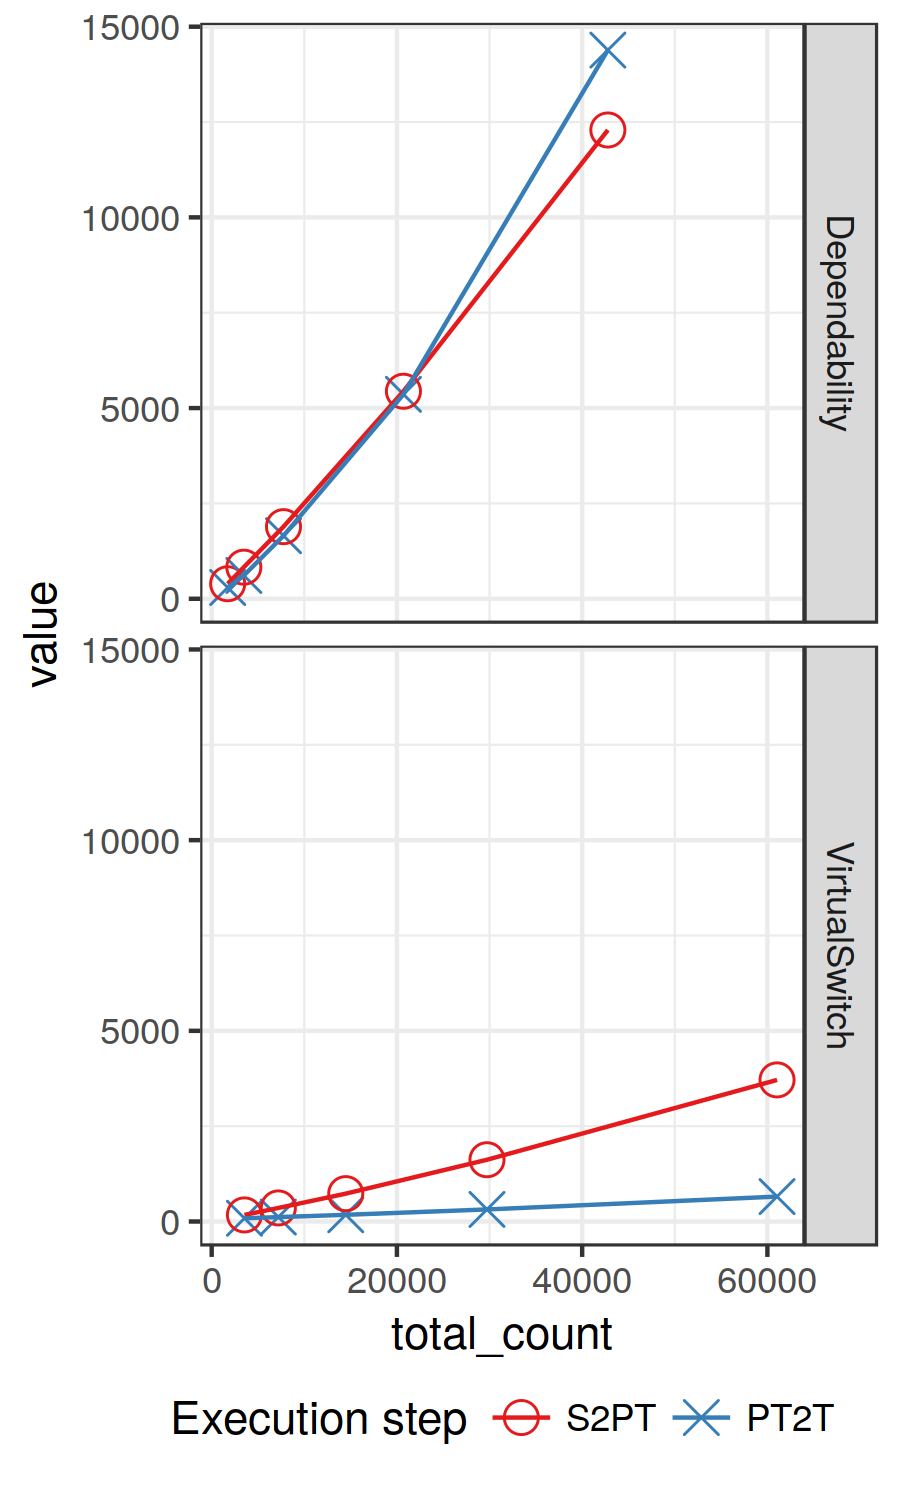
Our evaluation results comparing the performance of core reactive VIATRA transformations and our view model approach are presented in Fig. 1-3, where the two VIATRA transformations (source vs. trace-reactive) have very similar behavior. The two key internal phases of our approach separating the source-to-partial model (S2PT) transformation and partial-model-to-target (PT2T) materialization stages (with propagation and concretization) are presented in Fig. 4.
Since the VirtualSwitch case is dominated by the size of the source model while the Dependability case is dominated by size of the target model, the logarithmic horizontal (x) axis presents a combined model size as the geometric mean (sqrt(|src| * |trg|)) of source and target model sizes (i.e. number of objects) which is compatible with the logarithmic scale of the plots. The logarithmic vertical (y) axis presents the execution times (in ms).

Fig. 1. Comparison of our approach with VIATRA reactive transformations.

Fig. 2. Comparison of our approach with VIATRA reactive transformations (continued).

Fig. 3. Comparison of our approach with VIATRA reactive transformations (continued).

Fig. 4. Comparison of the S2PT and PT2T stages.
The intermediate partial model for the largest source models had (1) 38K partial model variables and 58K partial model atomic statements which represents 8K target objects (VirtualSwitch) and (2) 222K partial model variables and 401K partial model atomic statements to represent 72K target objects (Dependability).
Table 4. Partial model sizes.
| Scale factor | Case study | Partial model variables | Partial model constraints |
|---|---|---|---|
| 1 | Dependability | 9023 | 16277 |
| 2 | Dependability | 18137 | 32719 |
| 4 | Dependability | 40413 | 72907 |
| 8 | Dependability | 107689 | 194285 |
| 16 | Dependability | 222231 | 400936 |
| 16 | VirtualSwitch | 2135 | 3280 |
| 32 | VirtualSwitch | 4536 | 6992 |
| 64 | VirtualSwitch | 8920 | 13720 |
| 128 | VirtualSwitch | 18429 | 28360 |
| 256 | VirtualSwitch | 38021 | 58520 |