Histogram events & bin hover label improvements #2113
Conversation
…ranges in hover labels
make histogram hover wrap bar hover, rather than being conditionals inside it
| // don't trust floating point equality - fraction of bin size to call | ||
| // "on the line" and ensure that they go the right way specified by | ||
| // linelow | ||
| var roundingError = 1e-9; |
There was a problem hiding this comment.
I'm a little surprised that this hadn't come up before (other than the test below that was actually wrong before), and obviously it's a bit questionable exactly what small fraction to put here... but if we just use straight < vs <= etc it's pretty easy to trick findBin on the edges.
src/components/fx/hover.js
Outdated
| // and convert the x and y label values into formatted text | ||
| if(d.xLabelVal !== undefined) { | ||
| d.xLabel = ('xLabel' in d) ? d.xLabel : Axes.hoverLabelText(d.xa, d.xLabelVal); | ||
| d.xLabel = ('xLabel' in d) ? d.xLabel : getDimText(d, 'x'); |
There was a problem hiding this comment.
@etpinard I made getDimText in parallel with you adding d.(x|y)Label and Axes.hoverLabelText - I suppose in principle we could use d.(x|y)Label for this too instead of adding d.(x|y)LabelVal(0|1), maybe that would actually be simpler... let me take a look.
There was a problem hiding this comment.
yeah, better to use d.(x|x)Label -> 51ad8c2
There was a problem hiding this comment.
Much better in 51ad8c2
Thanks!
| cdi.p1 = roundFn(binEdges[i + 1], true); | ||
|
|
||
| // pts and p0/p1 don't seem to make much sense for cumulative distributions | ||
| if(!cumulativeSpec.enabled) { |
There was a problem hiding this comment.
A questionable decision... this gets at some of the same issues that led to cumulative.currentbin but in principle a CDF shows the sum of all the data prior to a specific point, not the data within that bin. perhaps I should shift p0 and p1 depending on currentbin so that the hover label at least gets the description "all the data prior to X" precisely correct, even though it'll be a different value than the center of the bar...
And then what about pts? You could say it should be included and again should be "all the data prior to X" but then it would be meaningless to select a single bar and not all the bars before it. Alternatively pts could contain "all the data that was added in this bar" which might be more useful in terms of selecting a single bar, but it's not really what that bar means.
There was a problem hiding this comment.
so that the hover label at least gets the description "all the data prior to X"
Yeah. I think something along those lines would be useful down the road.
You could say it should be included and again should be "all the data prior to X" but then it would be meaningless to select a single bar and not all the bars before it. Alternatively pts could contain "all the data that was added in this bar"
Sounds to me like both all-data-prior-to-X and data-added-in-this-bar point lists could be useful, so we'll might have to emit both in the future. Leaving this discussion for another time is 👌 with me. I doubt that most plotly.js users even know about cumulative histograms.
There was a problem hiding this comment.
Great, I'll make a new issue to discuss how this should work for CDFs.
|
|
||
| // too small of a right gap: stop disambiguating data at the edge | ||
| _test(0, 0.0009, [0, 1, 2], false, [0, 1, 1, 2]); | ||
| _test(0.1, 0.009, [115, 125, 135], false, [115, 125, 125, 135]); |
There was a problem hiding this comment.
to be clear, what these tests are indicating is that the hover labels for these bins will be 115 - 124.99 and 125 - 134.99 on the disambiguated side of the cutoff, and 115 - 125 and 125 - 135 on the too-many-digits-to-disambiguate side.
| [cn1_00, Lib.dateTime2ms('2009-01-01', cn), cn1_10, Lib.dateTime2ms('2019-01-01', cn)]); | ||
| // occasionally we give extra precision for world dates (month when it should be year | ||
| // or day when it should be month). That's better than doing the opposite... not going | ||
| // to fix now, too many edge cases, better not to complicate the logic for them all. |
There was a problem hiding this comment.
The algorithm I came up with for figuring out how many digits to show is basically:
- find the minimum distance from data points to bin edges from either side - this is just two numbers for the whole distribution
- for two consecutive bins, find the largest digit that changes in both the left and right gaps (with a little shifting to account for rounding errors)
This algorithm is a little complicated to state, but it's quick to calculate and it's robust as far as I can see, on numeric, category, and gregorian date axes (though even in that case there is a weird edge case that confuses it). However, the larger variability of month and year lengths in world calendars causes it to sometimes think a digit doesn't change when in the actual data it does, and increasing the tolerance to catch this breaks some much more common cases.
I suspect we could fix this by looking at all bin edges independent of each other, but that's far more computationally intensive, and has some other potential weird pitfalls. I don't think providing a bit of extra precision in the label for a few world calendar cases justifies all that extra complexity.
There was a problem hiding this comment.
✨ algo. Thanks for stating it in details.
Can you comment on what modifications (if any) your algo will need when we implement variable-sized bins #360?
There was a problem hiding this comment.
The issue with dates is that the actual time increments - the "digits" we're looking to see if they have changed - have different sizes in terms of milliseconds. The bin sizes being different should not be a problem, though people could do things to thwart the algorithm, like having the first two bin edges on fairly round values but some subsequent edges at not-so-round values. The idea that two edges are enough to determine the biggest digit that always changes comes from the observation that if one bin is extra-round, its neighbor will not be. So to do this robustly with nonuniform bins, we could either:
- Do this same algorithm on all bin edges. That's different from looking at all bin edges independently as I suggested above for world calendars, though that would solve this problem too - what I'm suggesting here is to calculate just one left-edge-gap and one right-edge-gap as we do now, but then test those gaps against all bin edges instead of the first two.
- As a last resort, make a new attribute for folks to set their own rounding.
One common case mentioned in #360 is equally-sized bins on a log axis. There, the whole assumption of a single digit to round to is wrong, and we'll have to do something completely different or just give up on the idea of disambiguating the edges, and let the regular axis-formatting-for-hover system handle it unchanged.
and move range-or-single-value logic into Axes.hoverLabelText
|
|
||
| if(logOffScale) { | ||
| return val === 0 ? '0' : '-' + tx; | ||
| return val === 0 ? '0' : MINUS_SIGN + tx; |
There was a problem hiding this comment.
been around for a while, using regular dash instead of unicode minus. tested in 3aa03f7#diff-846cf5b534aa0d22bdd1da2b43ac3cbaR517
There was a problem hiding this comment.
I was wondering about that. Thanks 👌
| _hover(gd, 250, 200); | ||
| assertHoverLabelContent({ | ||
| nums: '3', | ||
| axis: '3.3' |
There was a problem hiding this comment.
Note: for histogram2d I applied this independently to each axis, not to each brick. So if one x brick has only the point (2, 3) and one above it has only the point (2.1, 4), this will make the x bins show ranges, because that one x bin has multiple values, even though each brick has unique values in it.
There was a problem hiding this comment.
Nice touch here. I was worried that category histograms would get e.g, apples - lemons bin hover labels. 👌
There was a problem hiding this comment.
That can happen - but only if the bins actually contain apples and lemons.
Plotly.newPlot(gd, [{
  x: ['apples','apples','apples','lemons','lemons','peaches','peaches','pears'],
  type: 'histogram',
  xbins: {start: -0.5, end: 3.5, size: 2}
}],{
  width: 400,
  height: 400
})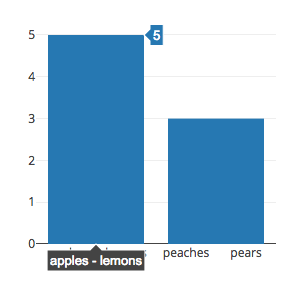
It's possible to put as many categories as you want into one bin, and as with numbers we'll only show the first and last ones in the label. Never happens automatically since it's in general confusing, but if you want to do it we won't stop you!
There was a problem hiding this comment.
but if you want to do it we won't stop you!
Cool. Would you mind adding a test case for this situation?
There was a problem hiding this comment.
Cool. Would you mind adding a test case for this situation?
src/components/fx/hover.js
Outdated
| // and convert the x and y label values into formatted text | ||
| if(d.xLabelVal !== undefined) { | ||
| d.xLabel = ('xLabel' in d) ? d.xLabel : Axes.hoverLabelText(d.xa, d.xLabelVal); | ||
| d.xLabel = ('xLabel' in d) ? d.xLabel : getDimText(d, 'x'); |
There was a problem hiding this comment.
Much better in 51ad8c2
Thanks!
|
|
||
| var barHover = require('../bar/hover'); | ||
|
|
||
| module.exports = function hoverPoints(pointData, xval, yval, hovermode) { |
|
|
||
| if(logOffScale) { | ||
| return val === 0 ? '0' : '-' + tx; | ||
| return val === 0 ? '0' : MINUS_SIGN + tx; |
There was a problem hiding this comment.
I was wondering about that. Thanks 👌
| .then(function() { | ||
| _hover(gd, 250, 200); | ||
| assertHoverLabelContent({ | ||
| nums: '\u22125', // unicode minus |
There was a problem hiding this comment.
Thanks for 🔒 ing this down!
| } | ||
| else { | ||
| cdi.p0 = roundFn(binEdges[i]); | ||
| cdi.p1 = roundFn(binEdges[i + 1], true); |
There was a problem hiding this comment.
❤️ ing that you were able to put all thing new rounding logic in calc.
| // 15-day gap - still days | ||
| _test(0, 15 * day, [jan17, jan18, jan19], 'gregorian', | ||
| [jan17, jan18 - day, jan18, jan19 - day]); | ||
| // 28-day gap STILL gets days - in principle this might happen with data |
There was a problem hiding this comment.
thanks for writing this down
| [cn1_00, Lib.dateTime2ms('2009-01-01', cn), cn1_10, Lib.dateTime2ms('2019-01-01', cn)]); | ||
| // occasionally we give extra precision for world dates (month when it should be year | ||
| // or day when it should be month). That's better than doing the opposite... not going | ||
| // to fix now, too many edge cases, better not to complicate the logic for them all. |
There was a problem hiding this comment.
✨ algo. Thanks for stating it in details.
Can you comment on what modifications (if any) your algo will need when we implement variable-sized bins #360?
| _hover(gd, 250, 200); | ||
| assertHoverLabelContent({ | ||
| nums: '3', | ||
| axis: '3.3' |
There was a problem hiding this comment.
Nice touch here. I was worried that category histograms would get e.g, apples - lemons bin hover labels. 👌
| }) | ||
| .then(function() { | ||
| _hover(gd, 250, 200); | ||
| assertHoverLabelContent({ |
There was a problem hiding this comment.
Would mind checking that plotly_hover does emit the correct event data?
There was a problem hiding this comment.
Good catch -> tested in 2696c1c
| cdi.p1 = roundFn(binEdges[i + 1], true); | ||
|
|
||
| // pts and p0/p1 don't seem to make much sense for cumulative distributions | ||
| if(!cumulativeSpec.enabled) { |
There was a problem hiding this comment.
so that the hover label at least gets the description "all the data prior to X"
Yeah. I think something along those lines would be useful down the road.
You could say it should be included and again should be "all the data prior to X" but then it would be meaningless to select a single bar and not all the bars before it. Alternatively pts could contain "all the data that was added in this bar"
Sounds to me like both all-data-prior-to-X and data-added-in-this-bar point lists could be useful, so we'll might have to emit both in the future. Leaving this discussion for another time is 👌 with me. I doubt that most plotly.js users even know about cumulative histograms.
|
Nicely done 💃 |
Implements #2071 (histogram events get the input points selected) and #2086 (better display of data ranges for histogram bins) for both
histogramand the 2d histogram types (histogram2dandhistogram2dcontour)