Conformance Test Tool
The Conformance Test Tool will host all conformance testing in Toolkit. The initial release is part of XDS Toolkit v4.0.0. New features will be added over time.
Each Document Sharing actor requires a different collection of supporting actors to support its testing. These actors must be initialized to a known state: configured with endpoints of other actors, IDs, and loaded with appropriate data. These actors and their state are referred to as the Testing Environment.
There are two types of test initiation: tool initiated and SUT initiated. This indicates whether the test tool or the SUT initiates the first transaction of the test.
The Conformance Test tool is organized into three area: testing environment setup, initialization, and test operation which are discussed in the following sections.
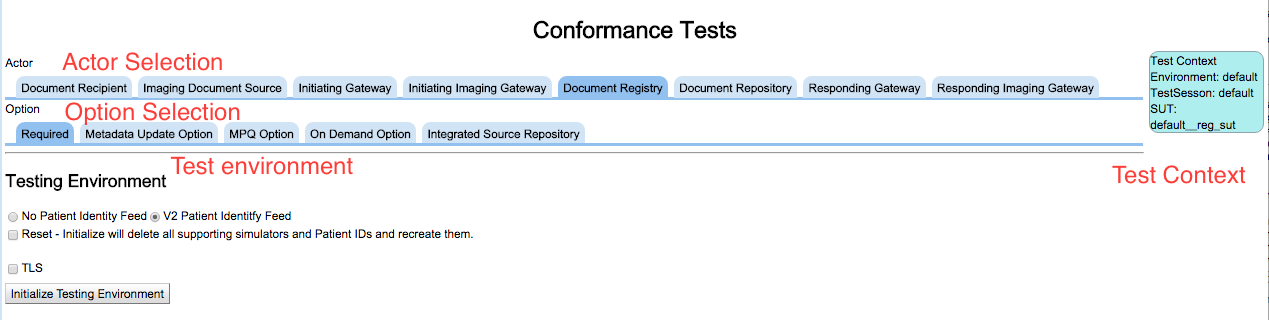
The Testing Environment Setup, shown above, starts with the selection of the actor type to be tested. Once selected the available profile options that affect the testing of this actor will be displayed. The first tab in this collection is always the Required tests for the selected actor type.
Before tests are run the Testing Environment must be initialized. Before this can be done we must indicate the system to be tested, the environment (Toolkit environment, not test environment) to be used and the test session where test results will be stored. These selections are made using the Test Context editor found in the upper right corner of the tool. This editor is documented separately here.
Once the Test Context is established, the button labeled Initialize Testing Environment can be used to build the testing environment. The initialization that occurs is different for each actor type.
As an example of actor specific initialization, this is what happens for testing a Document Repository. A Document Registry simulator is created. A Patient ID is generated an is sent to the Registry in a Patient Identity Feed message. Instructions are then displayed for the user to configure the Repository under test to forward Register transactions to this Registry simulator.
When this initialization is complete, status and details about the initialization is displayed immediately below.
This automatic creation of the necessary supporting state is called Orchestration.
While the orchestration is different for each actor type there are parts common to all actor types.They are the Reset, SAML, and TLS selections.
If Reset is selected when the orchestration is created via Initialize Testing Environment button then the existing state (simulators, Patient IDs etc.) are deleted and re-generated. If Reset is not selected then the stored state of the orchestration is loaded and displayed. Reusing the orchestration is the typical way to use the tool. A reset destroys all existing state and may affect tests not yet completed. But, it is always necessary to have a reset button.
The SAML and TLS selections control whether SAML and TLS are used when conducting the test. They can be set and unset as is needed by the tool user. For example to run a single test without TLS, un-select the TLS selection and run the single test. To re-run the test with TLS simply set the TLS selection and run the test again. Same usage follows for SAML.
The operation of the SAML system is documented here.
An example of the orchestration output is:
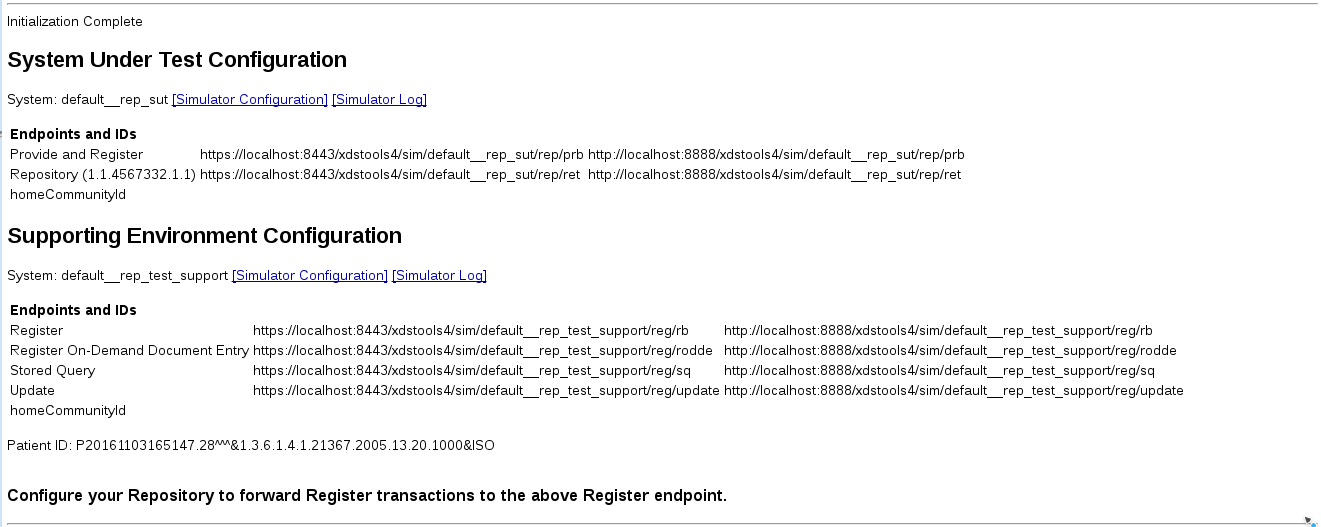
The System Under Test Configuration documents what is known about the SUT. In this example the SUT is a simulator so links to its configuration and logs are provided.
The Supporting Environment Configuration section documents the elements that were created by orchestration to support the testing process. In this case a Registry simulator (with links to its configuration and logs as well as a summary of its configuration) and a single Patient ID that will be used.
Finally an instruction is issued to configure your Repository SUT.
This tool maintains a great amount of state regarding your testing activities. Each time you open this tool this state must be loaded into the display. This can be done automatically or manually based on configuration.
In toolkit.properties (edited with the Toolkit Configuration tool) is a property named Auto init conformance tool. If set to true then the Conformance Test Tool will initialize the screen, including loading the orchestration results (test environment initialization) automatically when you select an Actor type or option. If this property is set to false then you will have to use the Initialize Testing Environment button to load all of the current status.
There are times when you want to discard your current test results and start again. This can be done at two levels.
Within the initialization section of the tool is a check box labeled Reset - Initialize will delete all supporting simulators and Patient IDs and recreate them. If set when you press the Initialize Testing Environment button the current test context (orchestration) will be discarded and recreated. This includes the Patient IDs used. Beware that when this is done the content is really deleted. You must separately delete the test results using the trash can icon.
The other approach is much broader. The above reset affects the initialization and results for a single option on a single actor. If you want to a big delete open the Test Context dialog (blue box on the upper right corner of the display), select a Test Session and press Clear Test Session. This will delete the orchestration and test results for all actors tested using this test session. It will even forget which system you were testing.
There are three color codes used in the display:
- white - test collection/test/section/step not run
- red - test collection/test/section/step run but with error
- green - test collection/test/section/step run successfully
Note that along with the red color, errors are also shown with a danger symbol and successes are shown with the check mark symbol.
This shows the top level view of the Test Operation portion of the Conformance tool.
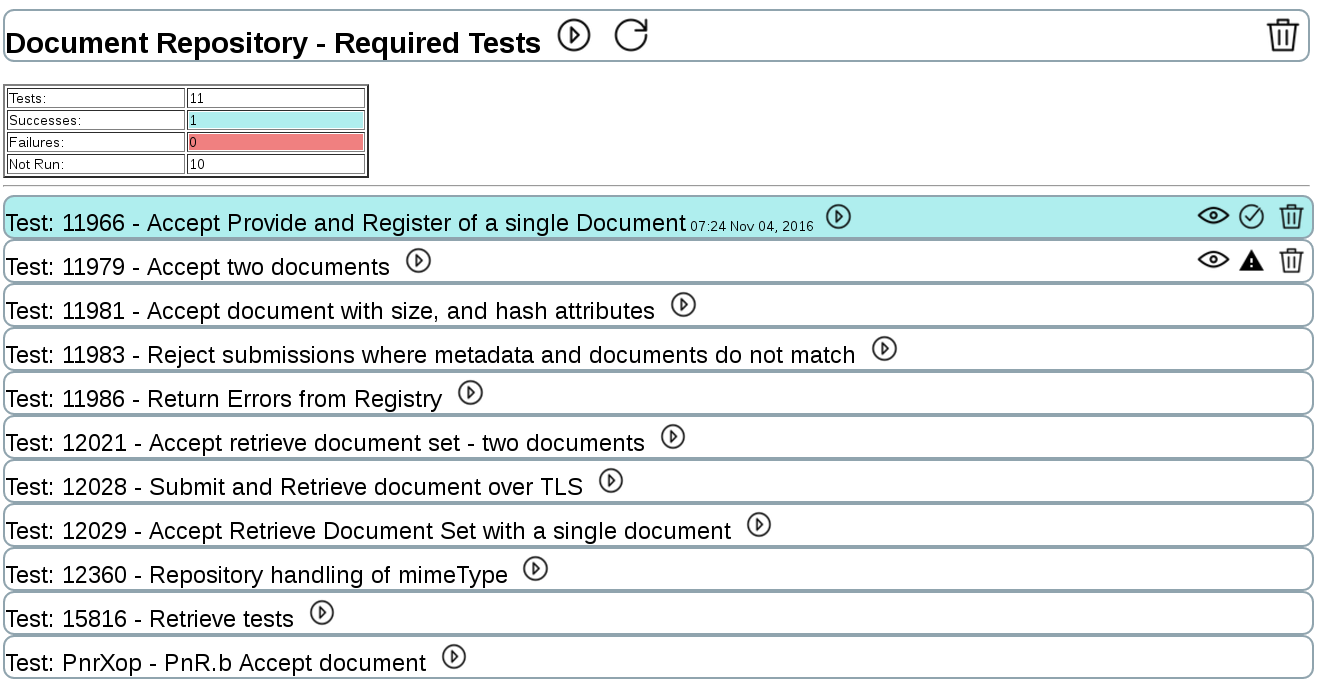
The top bar displays an overview of the testing. In this example the words Document Repository - Required Tests indicate the actor type being tested and the test grouping selected. The bar has a white background since not all tests have been run.
Next is a right-facing arrow which is the run button. Since this run button is on the overview, it runs all tests in the collection. The recycle button reloads test status in cases where something changed on disk but is not reflected in the display. The trash can deletes all test logs for this test collection.
Following the top bar is a table of test statistics. The color codes are documented in this table.
The rest of this section is the list of tests each shown as a horizontal bar. Each is color coded with its status. Tests that have been run (with error or success) show a run date and an eyeball icon which takes you to the test details tab (Toolkit Inspector).
Clicking on a test bar will open the test showing its details right below the bar. Any number of tests can be open at once.
When a test that has been run is opened the first thing displayed is the interaction sequence diagram.
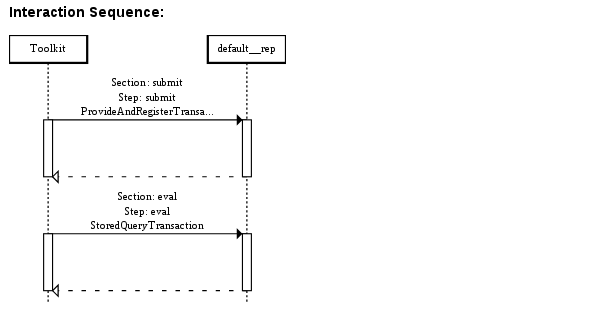
Note: In release 4.0.0 this diagram shows minimal information and does not properly show interactions between more than two actors. It will be expanded in later releases.
This diagram shows the messages passed between tools and SUTs. Each message, when clicked, will open the Inspector tab showing the details of the transaction (same as the eyeball icon).
Messages carrying errors are marked with an X symbol. The X is colored blue if the error was expected and red if it was not expected.
Next in the display is the collection of sections. (More about sections).
Since a section is independently runnable there is a run button and run date.
Note that there is no inspect button (eyeball). At the moment the Inspector tool is test oriented and not section oriented so the ability to launch the inspector to view test logs is only attached to the test display.
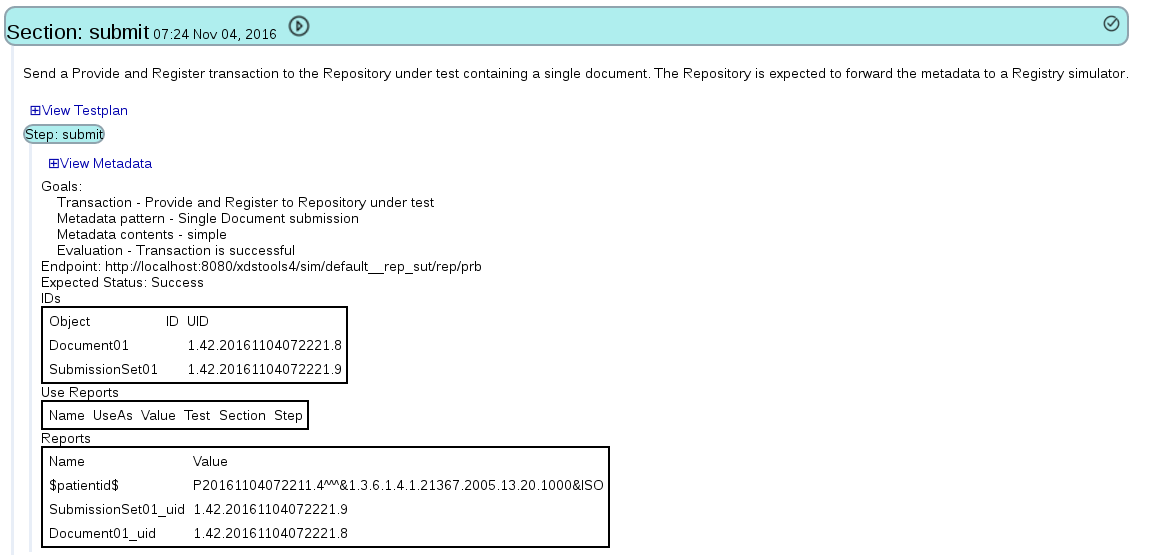
A section displays its documentation at the top. Next is a link to display the testplan. The testplan is the XML encoded script that actually runs the section execution. It is viewable because many users are familiar with its format and semantics.
Next is displayed the steps within the section. The header of the step includes the goals of the step, the endpoint used and the expected status (Success or Failure - negative testing is supported so sometimes Failure is the expected outcome).
The generated IDs are displayed. Two kinds of IDs are generated and documented here: entryUUIDs and uniqueIds. Every DocumentEntry, Folder, and SubmissionSet contains a uniqueId which is assigned by the Document Source. They are included here. The Document Source may allocate UUIDs for those objects. If they are allocated then they are published here as well.
Next is the Use Reports and Reports. They define a publish/subscribe feature that is used by one step to publish a value that can be subscribed to by a later run step. Reports publish IDs that may be used later so they include a name and a value. Use Reports target a published Report so they include parameters to target the specific Report (Test, Section, Step and Name). They also include UseAs which indicates the local variable (in the metadata included in the testplan) to be updated. The reported value is also displayed.
Links and buttons in this tool connect the user to the following tools:
- Simulator configuration tool
- Simulator log display tool
- Test Results Inspector tool
- Test Context editor