Adding Reporting feature to your Sample App
This tutorial will teach you how to create a report in Quickforms. We will recreate the Department report in our sample application by using two main controls, report graph and table summary, as shown below.
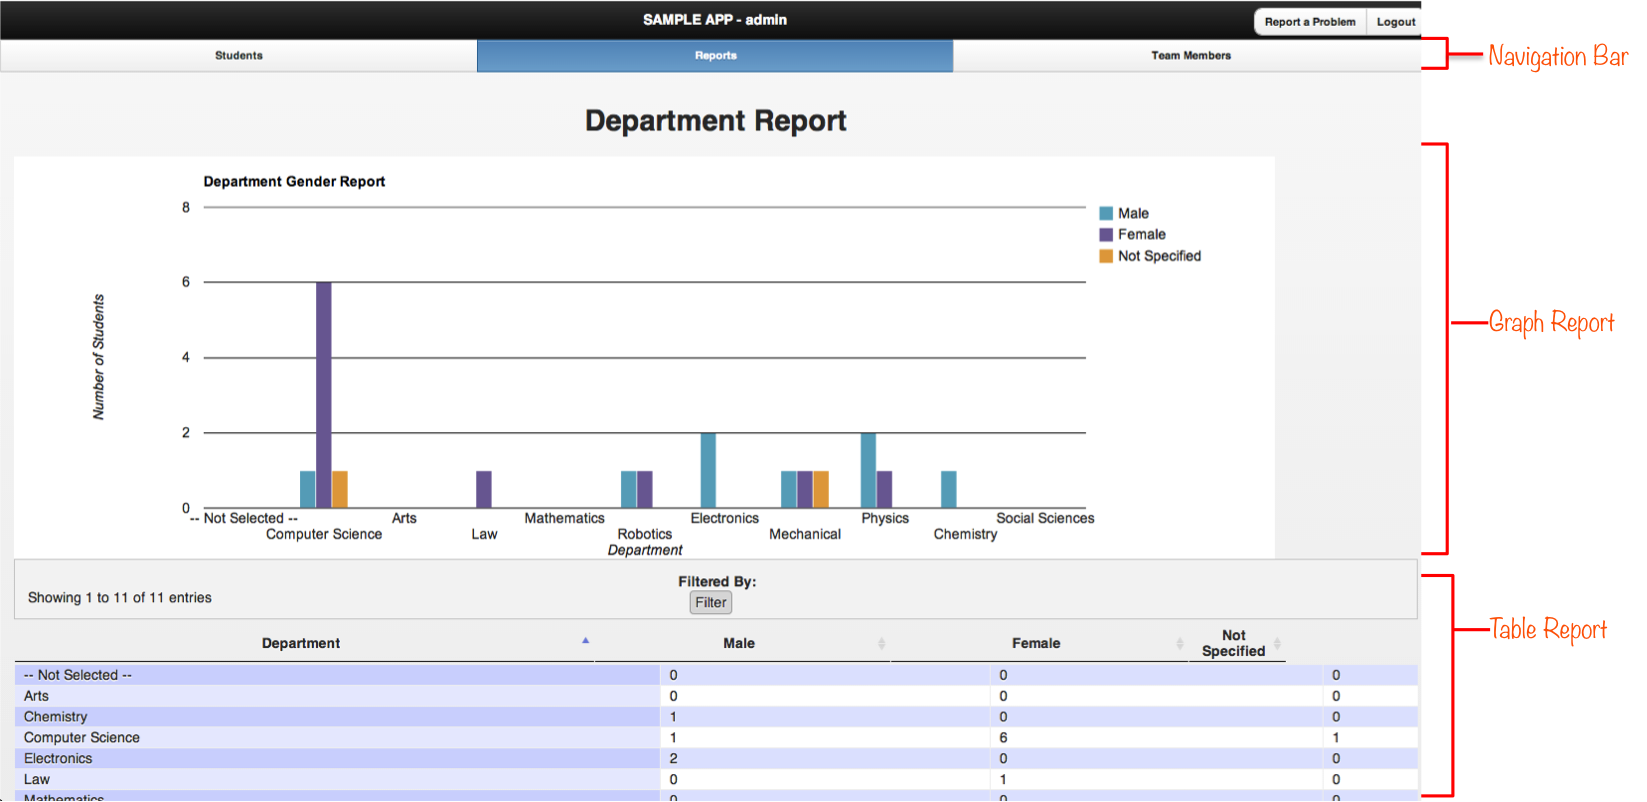 See a bigger version of this image
1 . Create a new reports.html file in your application folder.
Example: C:\Program Files\Apache Software Foundation\Tomcat 8.0\webapps\sample\reports.html
2 . Copy the following code into your reports.html file:
<meta http-equiv="X-UA-Compatible" content="IE=Edge">
<html class = "ui-mobile-rendering">
<head>
	<meta name="viewport" content="width=device-width, initial-scale=1">
	<link rel="stylesheet" href="../quickforms/css/quickforms/quickforms.css" />
	<script src = "../quickforms/js/require.min.js" ></script>
</head>
<body>
<div data-role="page" id="loadQuickformsTemplate">
	<script type="text/javascript">
	require(['../quickforms/js/quickforms.js'],function(){
			quickforms.registerReadyFunction(function()
			{
				require(['dom/navControl','dom/report/graph','dom/report/table'],
					function(){

						quickforms.loadNav('nav.html','nav');

						quickforms.loadTableReport(
							{queryName:'departmentGenderGraph',
							 configFile: 'js/departmentGenderTable'
							});
						quickforms.loadGraphReport(
							{queryName:'departmentGenderGraph',
							 graphParamFile:'js/departmentGender'});
					});
			});
		});
	</script>

</div>
</body>
</html>-
NOTE: Graph, table report and navigation controls needed to generate the Department report in our sample application are listed inside the
<SCRIPT>tag as follows:
 See a bigger version of this image
3 . Create a new departmentGenderTable.js javascript file in your application js folder. This file is specified in your loadTableReport configFile and is used for table customization.
Example: C:\Program Files\Apache Software Foundation\Tomcat 8.0\webapps\sample\js\departmentGenderTable.js
4 . Copy the following code into your departmentGenderTable.js file. Try changing width percentages for config.columnWidths (columns are separated by a comma) and notice the changes in your table structure.
define([],function(){
	var config = {};
        config.bProcessing= true;
        config.iDisplayLength= 1000;
        config.sPaginationType= "full_numbers";
        config.aaSorting= [[0,"asc"]];
        config.sScrollX= "100%";
	config.sScrollXInner= "101%";
	config.bScrollCollapse= true;
        config.sDom= '<"top"i<"filter_result"><"clear"><"filter_button"><"clear">>rt<"bottom"<"clear">>';
        config.columnWidths = ['50%','25%','25%','0%','0%','0%'];
	return config;
});
5 . Create a new departmentGender.js javascript file in your application js folder. This file is specified in your loadGraphReport graphParamFile and allows for basic customization of your graph. For example: Display report title, x-axis title and y-axis title, graph type etc.
Example: C:\Program Files\Apache Software Foundation\Tomcat 8.0\webapps\sample\js\departmentGender
Add the following content to your file:
define([],function(){
	var config = {};
	config.title="Department Gender Report";
	var backColor = '#ffffff';
	var axisColor = '#3e3e3e';
	var gridlinesColor = '#000000';
	var axisTitleColor = '#333333';
	var color1 = '#4BACC6';
	var color2 = '#8064A2';
	var color3 = '#eda637';
	var color4 = '#a7a737';
	var color5 = '#86aa65';
	var color6 = '#8aabaf';
	var color7 = '#69c8ff';
	var color8 = '#3e3e3e';
	var color9 = '#4bb3d3';
	config.height=450;
        config.width= '100%';
	config.vAxis= {maxValue: 100};
	config.backgroundColor= backColor;
	config.chartArea={width:"70%",height:"75%"};
	config.hAxis= {title: 'Department', textStyle: {color: axisTitleColor}};
	config.vAxis= {title: 'Number of Students', gridlines: {count: 5, color: gridlinesColor},format:0, baselineColor:axisColor, textStyle:{color: axisTitleColor}};
	config.colors= [ color1, color2, color3, color4, color5, color6, color7, color8];
	config.visType="ColumnChart";
	return config;
});
6 . Now in our reports.html file, we have to place the navigation bar, graph and table. We add the following in below </SCRIPT> tag
<div data-role="header"><h1>SAMPLE APP</h1></div>
	<div id = "nav"></div>
	<div data-role="content">
		<form id="tableTemplate">
			<h1 align = "center">Department Report</h1>

			<div id="chart"></div>

			<table id ="mainData"></table>
		</form>
	</div>
	<div data-role="footer"><h1>.</h1></div>
The main elements of the above code are:
- To add the navigation bar we use
<div id = "nav"></div>. We give an id name same as mentioned inquickforms.loadNav('nav.html','nav');inside<SCRIPT>tag - Inside
<form id="tableTemplate">, we add the graph using<div id="chart"></div>and the table report using<table id ="mainData"></table> - Note: In our Add navigation to your app tutorial we already have added reports.html as shown below in nav.html
  <div data-role="navbar">
	<ul>
            <li qf-users = 'Administrator'><a href="forms.html" rel="external">Students</a></li>
            <li qf-users = 'Administrator'><a href="reports.html" rel="external" >Reports</a></li>
			<li qf-users = 'Administrator'><a href="users/index.html" rel="external">Team Members</a></li>
	</ul>
</div><!-- /navbar -->
NOTE : In the above nav.html, we have added qf-user as Administrator. This is what admin will see when logs in to the application. The admin will see 3 tabs
| Students | Reports | Team Members |
|---|
7 . Now test your report: Clear your cache in the browser or refresh your Sample app and click on Reports tab. In our next tutorial [Add filter in your App](Add\ filter\ for\ your\ Graph\ and\ table) we will add a filter control for graph and corresponding table.