-
Notifications
You must be signed in to change notification settings - Fork 0
Reports
Business intelligence provide historical, present as well as predictive views of your data. There are many functions and tools involved in BI being the most common functions report generation and analysis. Reporting means collection and presenting data for analysis.
Reporting offers several benefits to the organization, as it is the main resource for data analysis. Reports helps you to:
- Analyse data, including historical data that can be tracked over time.
- Generate knowledge to become experts in the area of business.
- Generate the figure to backup actions or to explain decisions.
Lets follow our sample application:
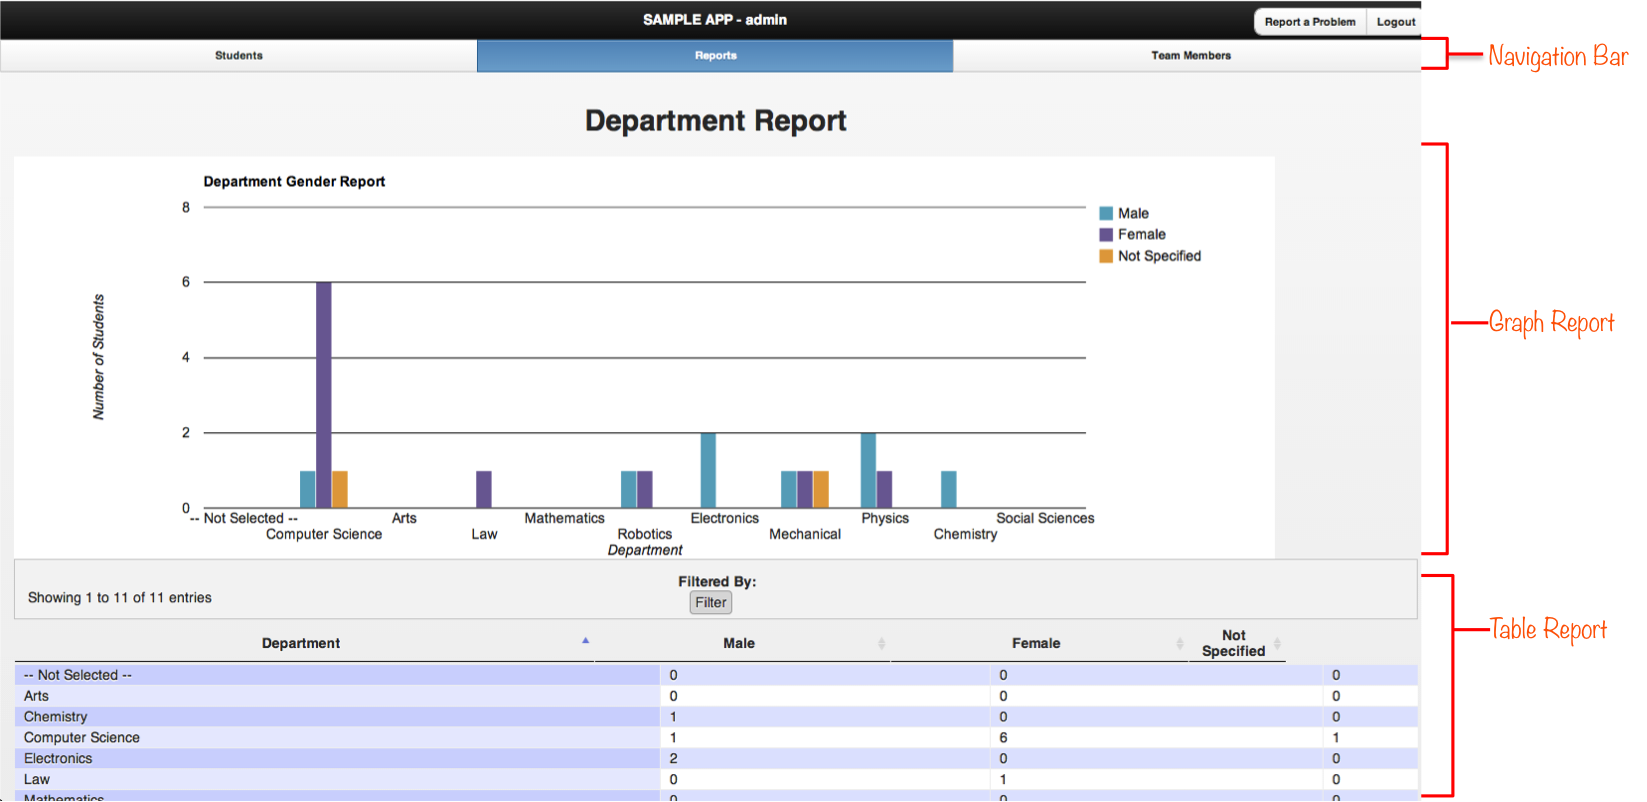
We see the below report in the sample application:

The report is divided into two parts - a graph report and a table below the graph that corresponds to the data represented in the graph.
Graph Report
- Graph report or chart report involves the pictorial representation of the data that has to be reported to the end user. The data here is classified based on the specific scales and the graph is drawn accordingly.
Table Report
- Table reporting format is the simplest form of reporting displaying data in terms of rows and columns
- Below is the sample picture of the table report in sample application.
Note: Since we can define different levels of access in Quickforms applications (admin or user), reports can be user specific , i.e. only showing data logged by the user or allowing a user access to specific reports. However, administrators can see the reports of the whole application.
To learn more about how to create a report, follow the below tutorial:
[Create a Report](Adding\ Reporting\ feature\ to\ your\ Sample\ App)
-
Quickforms Basics
-
Tutorials
- Setup Tutorials
- App Development Tutorials
-
Assignments
-
Project
-
Applications
-
Quickforms Advanced
- Project With Database
- Advanced Setup
- HealthApp with Database
- Source Control
- Joining the Team
- Cordova Native Application
- Miscellaneous
- Project With Database
-
-
Form Controls
-
App Controls
-
Report Controls
-
Server Controls
-
Quickforms DAO
-
Email Notification
-
Migrating QuickForms3(Test Server) to QuickForms(Production-Server)