Compare more than two datasets (ANOVA)
Compute a point-by-point ANOVA using multiple datasets. The model can include any combination of within and between-subject factors. The function also implements permutation testing to identify significant clusters in the obtained statistical time-courses or maps.
To use this function, you must create merged datasets, where each epoch corresponds to a measure (e.g. the average waveform of a given subject). For within-subject factors, each epoch of the different datasets must correspond to the same subject.
- Factor name. The name of the factor that you wish to add to the ANOVA model.
- Add as within factor. Add the factor as a within-subject factor.
- Add as between factor. Add the factor as a between-subject factor.
- Clear All. Clear the ANOVA model.
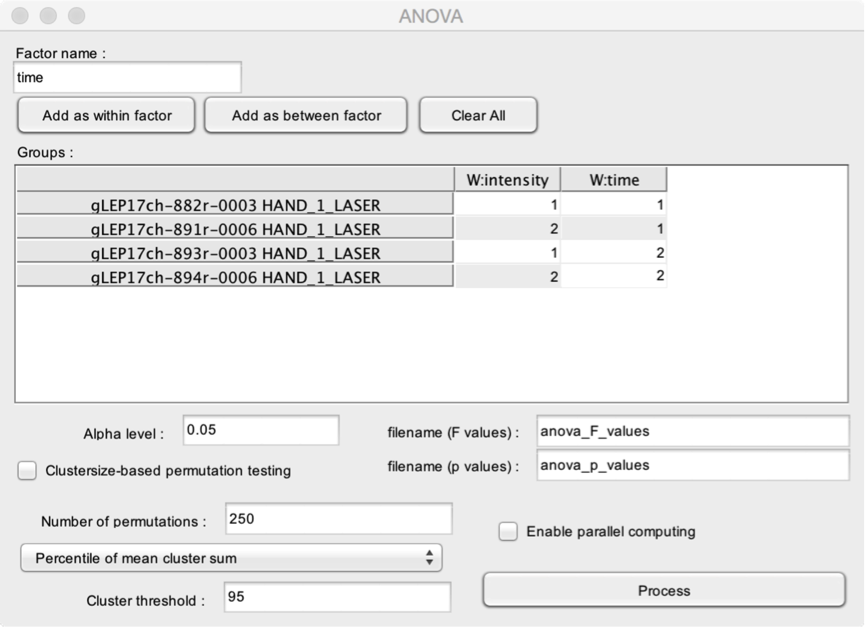
The Groups table is used to assign each dataset to the corresponding levels of the different factors. In this example, the model includes two within-subject factors, labeled ‘intensity’ and ‘time’. For the factor ‘intensity’, the 1st and 3rd files belong to level 1, and the 2nd and 4th files belong to level 2. For the factor ‘time’, the 1st and 2nd files belong to level 1, and the 3rd and 4th files belong to level 2.
- Filename (F values). The name of the output dataset containing the point-by-point F values.
- Filename (p values). The name of the output dataset containing the point-by-point p values.
- Enable parallel computing. This may speedup the analysis, especially, if you are running permutation testing.
- Alpha level. The minimum p-value to consider the result of the statistical test as “significant”.
The main issue of point-by-point statistical testing is the correction for multiple comparisons. Permutation testing can be a mean to address this issue (link). Permutation testing computes a distribution of the clusters of significant p values obtained when computing the statistical tests after permuting the datasets. The “strength” of each cluster is estimated using the sum of the test statistic within each significant cluster obtained using the permuted datasets. This distribution of clusters is then used to define a cluster threshold. The cluster threshold is applied to the result of the statistical test applied on the non-permuted datasets, such as to discard all clusters which are below the cluster threshold.
- Clustersize-based permutation testing. Perform a clustersize-based permutation testing. This can be very time consuming.
- Number of permutations. The number of permutations to be used to build the clustersize distribution.
Several methods are proposed to define the threshold distinguishing between “significant” and “non significant” clusters:
- Standard deviation of mean cluster sum. The threshold is defined as a z-score using the mean and standard deviation of the distribution of all significant clusters obtained using permutation testing (e.g. Z>2).
- Standard deviation of maximum cluster sum. The threshold is defined as a z-score using the mean and standard deviation of the distribution of the most significant cluster obtained for each permutation testing (e.g. Z>2).
- Percentile of mean cluster sum. The threshold is defined as a percentile using the distribution z of the distribution of all significant clusters obtained using permutation testing (e.g. >95%; this is equivalent to setting the cluster threshold to p <0.05).
- Percentile of mean cluster sum. The threshold is defined as a percentile using the distribution z of the distribution of the most significant cluster obtained for each permutation testing (e.g. >95%; this is equivalent to setting the cluster threshold to p <0.05).