-
Notifications
You must be signed in to change notification settings - Fork 30
Figure creators
A series of functions to generate publication-quality figures. These figures can then be pasted in a third-party vector graphics application.
- Waveforms
- Waveform averages
- Maps
- Lissajous plots
- 2D Scalp waveform arrays
- Scalp map time series
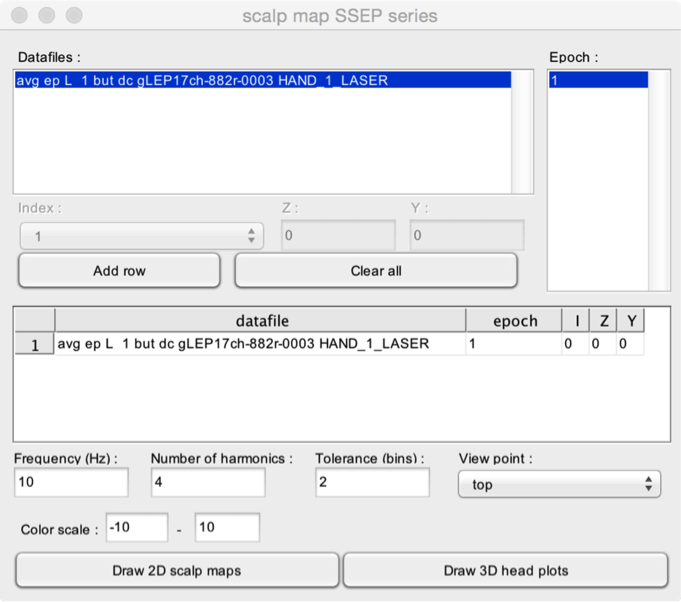
- Scalp map SS-EP series
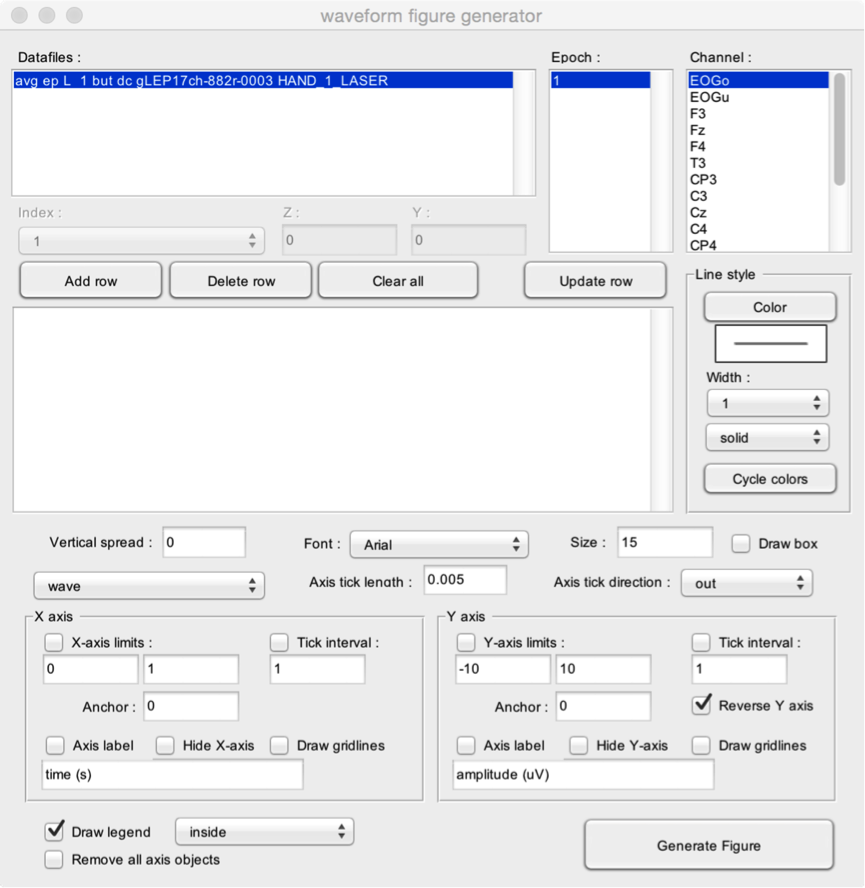
###Waveforms figure creator
Generate figures with waveforms.
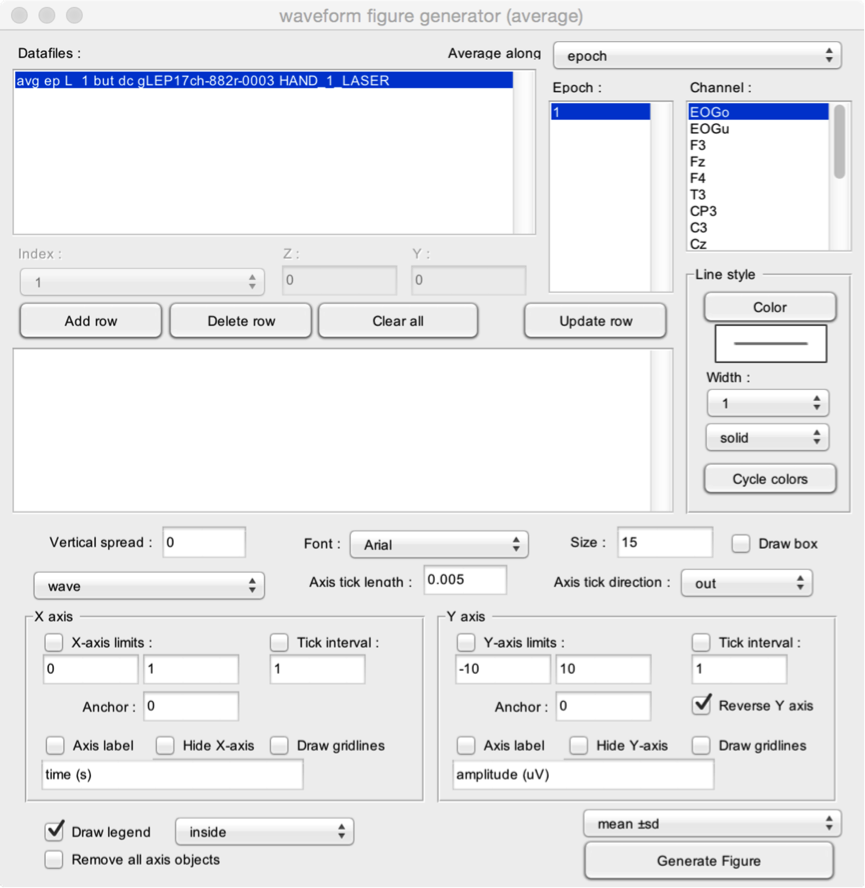
###Waveforms average figure creator
Generate figures with waveform averages.
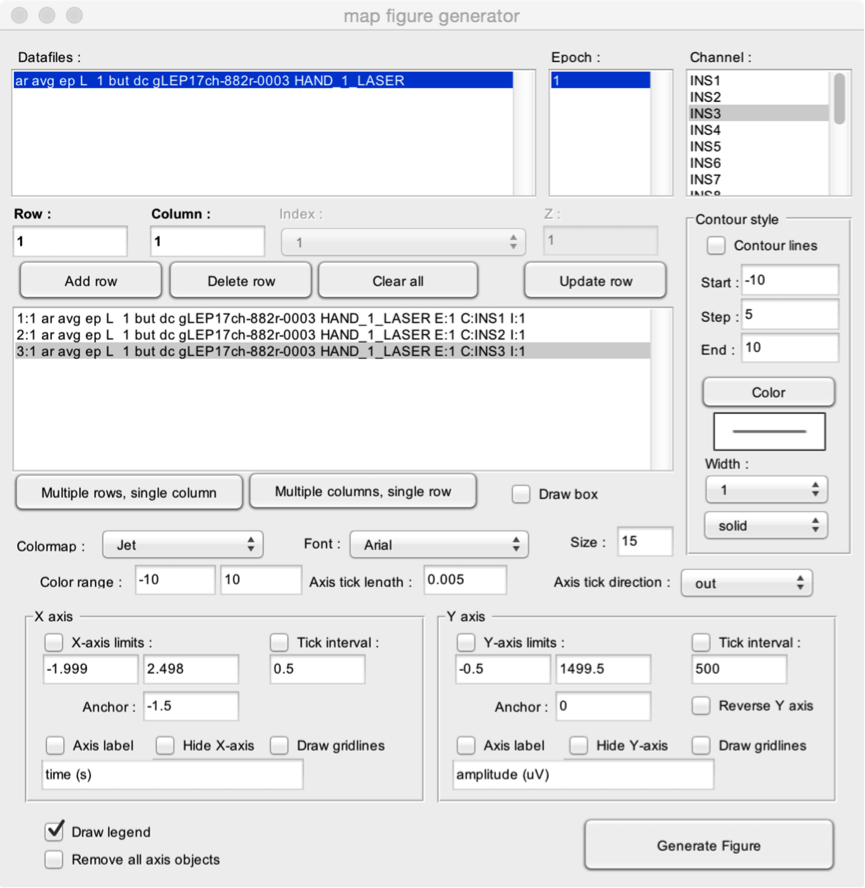
###Maps figure creator
Generate figures with 2D maps (e.g. time-frequency maps).
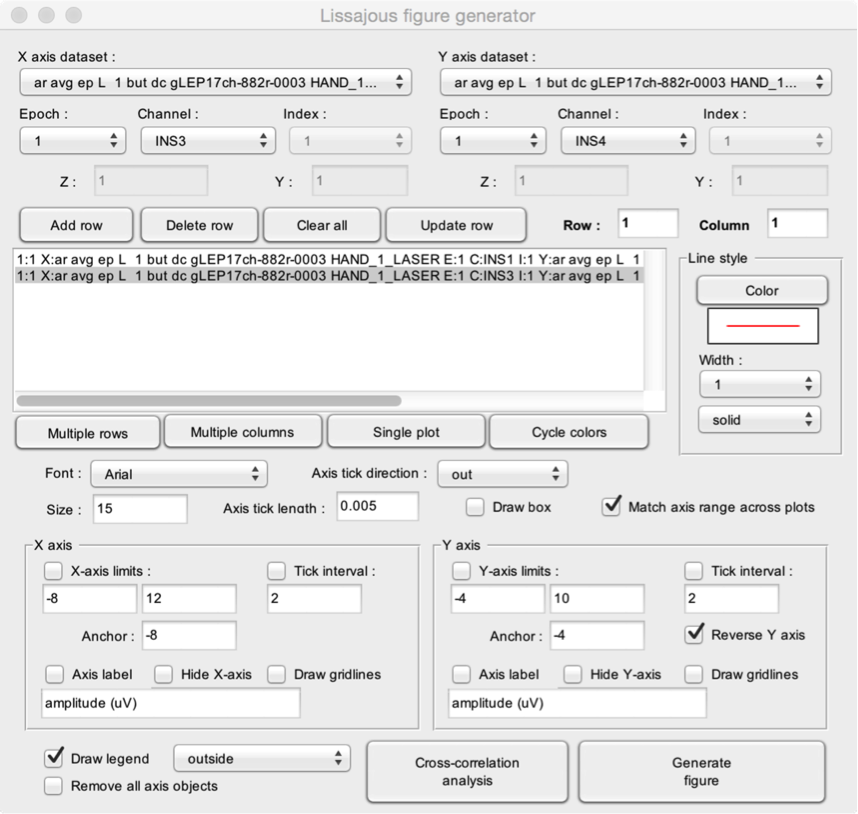
###Lissajous plots
Generate Lissajous plots and compute correlation and cross-correlation analyses.
###Waveform 2D scalp array figure creator
Generate a plot of waveforms arranged in a 2D scalp array according to electrode coordinates.
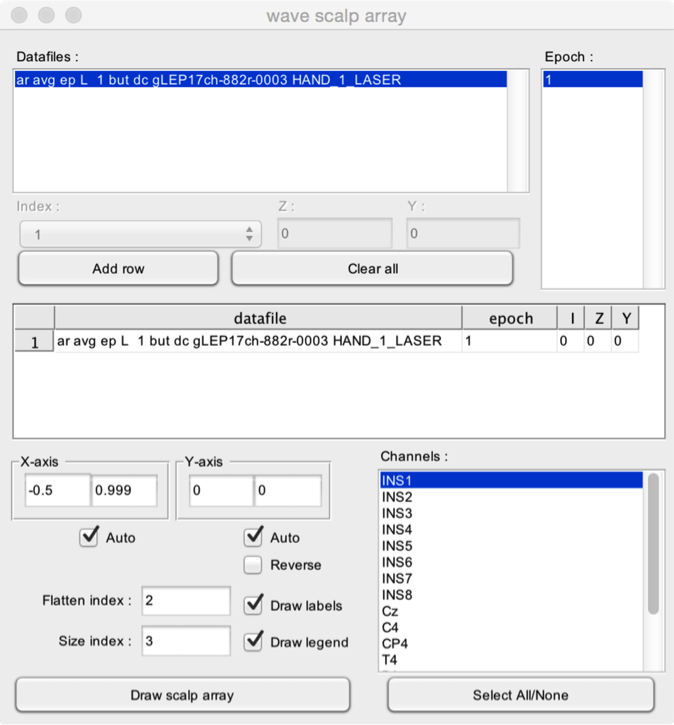
###Scalmap time series figure creator
Generate scalp maps within a range of latencies.

###Scalpmap SS-EP series figure creator
Generate scalp maps at SS-EP frequencies and their harmonics.
Plugins
User interface
File
Edit
Events
- Browse and edit events
- Delete duplicate events
- Create events from level trigger
- Merge event codes and latencies
Pre-processing
- DC removal and linear detrend
- Reference
- Frequency filters
- Spatial filters (ICA)
- Epoch segmentation
- Baseline operations
- Artefact rejection and suppression
- Current source density (CSD)
- Frequency and time-frequency transforms
- Time-frequency filters
- Resample signals
- Resample signals
- Arrange signals
Post-processing
- Average
- Single-trial analysis
- Math
- Source analysis (dipole fitting)
- Find peaks in waveforms
- Global explained variance
Statistics
- Compare datasets against a constant
- Compare two datasets
- Compare more than two datasets (ANOVA)
- Compare signal amplitude at event latencies
- Bootstrap test against a reference interval
Figures