-
Notifications
You must be signed in to change notification settings - Fork 30
Single trial analysis
These functions use the STEP method to estimate the latency and amplitude of ERP peaks at single-trial level. See Hu et al. (2010) for details. Two methods are implemented. Both methods are based on a multiple linear regression approach.
In the first method, a regressor and its temporal derivative are obtained from the across-trial average waveform. This basis set is then regressed against the corresponding time window of each single trial ERP waveform, thus yielding a latency and amplitude value for each ERP peak.
In the second method, an additional dispersion term is added to the regression, taking into account shape distortions to estimate the single-trial latency and amplitude of ERP peaks. The method is detailed in Hu et al. (2011).
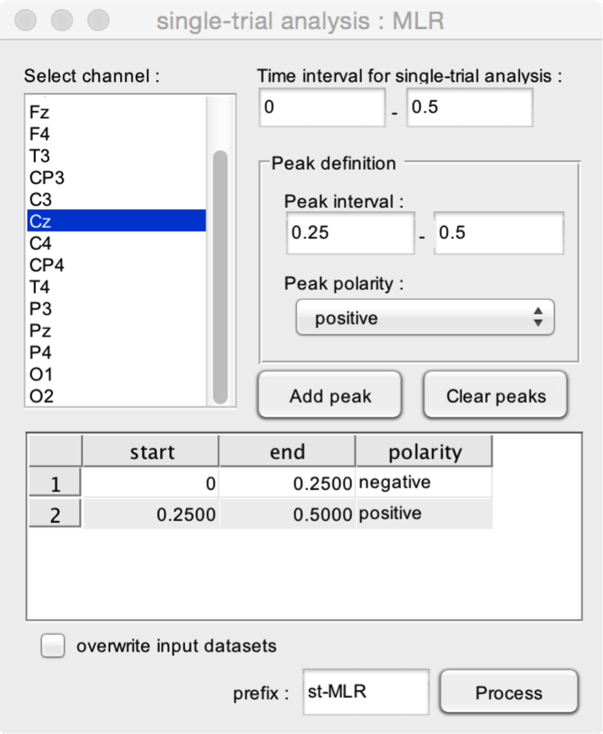
Find and estimate peak latencies and amplitudes at the level of single trials. This method is detailed in Hu et al. (2010).

- Select channel. Select the channel within which the function should estimate peak latencies and amplitudes.
- Time interval for single-trial analysis. The time interval to be used for the single trial analysis. This time interval should at least include the peak intervals.
The function can be used to estimate any given configuration of peaks. The Peak definition box is used to define and add peaks to the model.
- Peak interval. The time interval within which the peak should occur.
- Peak polarity. Defines whether the peak is positive or negative.
- Add peak. Add the defined peak configuration to the list of peaks.
- Clear peaks. Delete all peak definitions.
In this example, the function will estimate two peaks using the single-trial signals measured at electrode Cz. The first peak is a negative peak whose latency must occur between 0 and 0.25 s after stimulus onset. The second is a positive peak whose latency must occur between 0.25 and 0.50 s after stimulus onset.
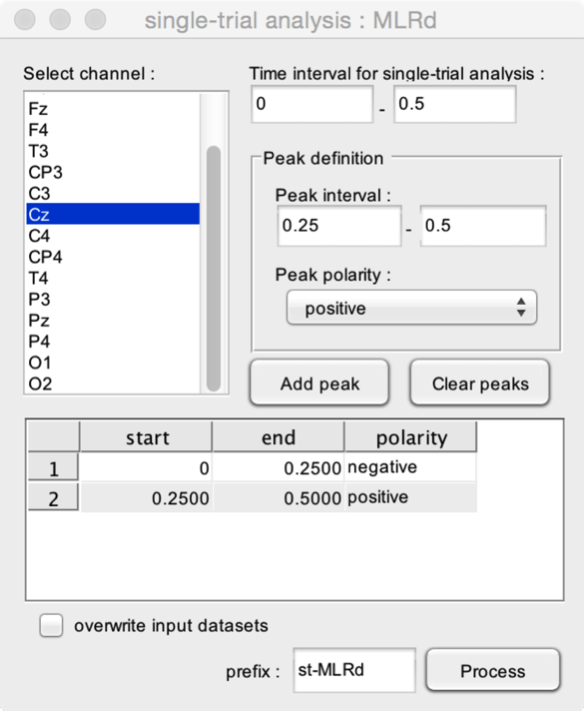
Find and estimate peak latencies and amplitudes at the level of single trials. As compared to the previous function, this introduces an additional ‘distortion’ parameter to account for variability in peak width across trials. The procedure is detailed in Hu et al. (2011).

- Select channel. Select the channel within which the function should estimate peak latencies and amplitudes.
- Time interval for single-trial analysis. The time interval to be used for the single trial analysis. This time interval should at least include the peak intervals.
The function can be used to estimate any given configuration of peaks. The Peak definition box is used to define and add peaks to the model.
- Peak interval. The time interval within which the peak should occur.
- Peak polarity. Defines whether the peak is positive or negative.
- Add peak. Add the defined peak configuration to the list of peaks.
- Clear peaks. Delete all peak definitions.
In this example, the function will estimate two peaks using the single-trial signals measured at electrode Cz. The first peak is a negative peak whose latency must occur between 0 and 0.25 s after stimulus onset. The second is a positive peak whose latency must occur between 0.25 and 0.50 s after stimulus onset.
Plugins
User interface
File
Edit
Events
- Browse and edit events
- Delete duplicate events
- Create events from level trigger
- Merge event codes and latencies
Pre-processing
- DC removal and linear detrend
- Reference
- Frequency filters
- Spatial filters (ICA)
- Epoch segmentation
- Baseline operations
- Artefact rejection and suppression
- Current source density (CSD)
- Frequency and time-frequency transforms
- Time-frequency filters
- Resample signals
- Resample signals
- Arrange signals
Post-processing
- Average
- Single-trial analysis
- Math
- Source analysis (dipole fitting)
- Find peaks in waveforms
- Global explained variance
Statistics
- Compare datasets against a constant
- Compare two datasets
- Compare more than two datasets (ANOVA)
- Compare signal amplitude at event latencies
- Bootstrap test against a reference interval
Figures