Multiviewers
A set of multi viewer functions can be used to visualize and compare the data contained in one or multiple dataset(s).
- Waveform multi-viewer
- Waveform average multi-viewer
- Waveform continuous data multi-viewer
- Waveform maps multi-viewer
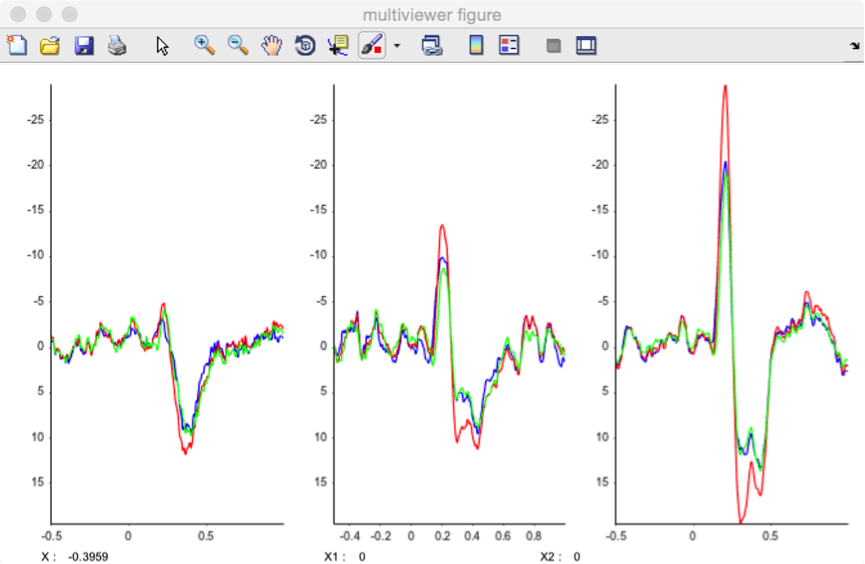
###Waveform multi-viewer
This is the default viewer for epochs datasets or averaged waveforms.
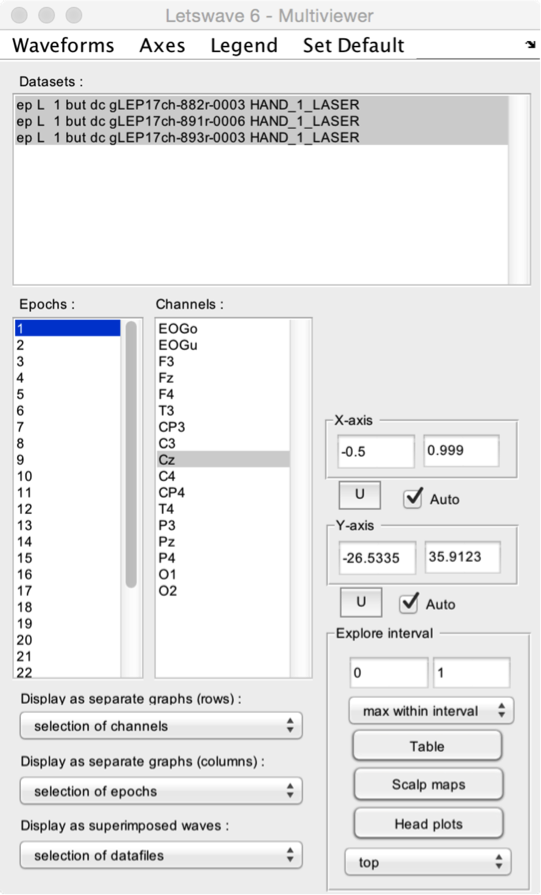
- Datasets. Select one or more datasets to display.
- Epochs. Select one or more epochs to display.
- Channels. Select one or more channels to display.
- Display as separate graphs (rows). Choose what should be displayed in separate graphs (organized as rows). This can be the selected datasets, epochs, or channels.
- Display as separate graphs (columns). Choose what should be displayed in separate graphs (organized as columns). This can be the selected datasets, epochs, or channels.
- Display as superimposed waves. Choose what should be displayed as superimposed waves across graphs. This can be the selected datasets, epochs, or channels.
- X-axis and Y-axis. Manually set the X- and Y-axis range, or set the range to Auto for automatic adjustment. Because the X- and Y-axis range can also be modified using the zoom and navigation tools of the Graph window, the U button can be used to update X- and Y-axis settings using the currently displayed range.
- Explore interval. A time interval can be defined by editing the lower and upper limits, or by selecting a range in the Graph window. After defining the interval, the Table button can be used to generate a table of descriptive statistics of the data within the interval. The Scalp maps button can be used to generate 2D scalp maps of the maximum (e.g. a positive ERP peak) or minimum (e.g. a negative ERP peak) values in the interval (defined using the Maximum within interval or Minimum within interval dropdown list). The Head plots button can be used to generate a 3D head plot of the signals.
Several display options can be adjusted using the dropdown title menu:
- Waveforms. The waveforms can be displayed as a plot graph, a stem graph, or a stair graph.
- Axes. The direction of the Y-axis can be set to normal (positive upwards), or reverse (negative upwards).
- Legend. A legend can be added to the graphs, displaying the name of the dataset, channel, or epoch.
- Set default. Set the current settings as default.
###Waveform average multi-viewer
This viewer is designed to view average waveforms of epoched data.
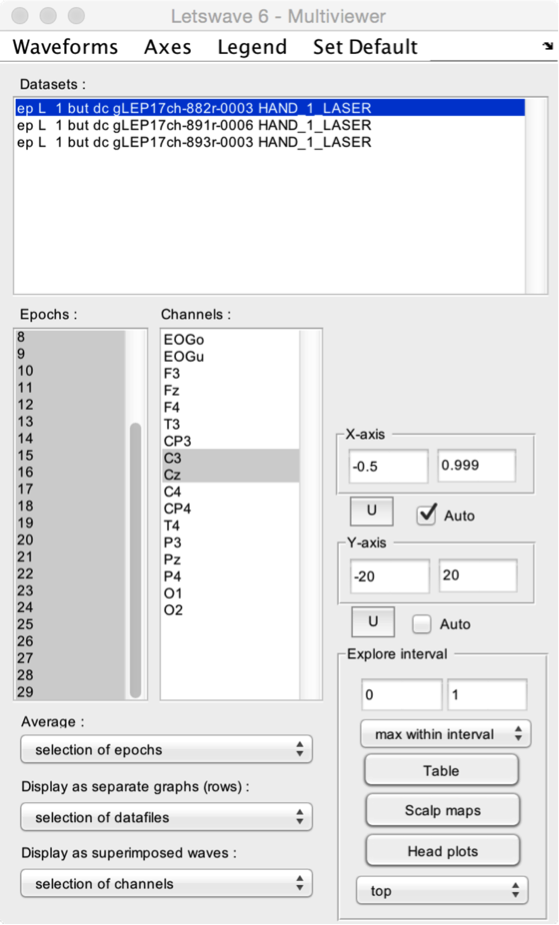
- Datasets. Select one or more datasets to display.
- Epochs. Select one or more epochs to display.
- Channels. Select one or more channels to display.
- Average. Choose what should be averaged. This can be the selected datasets, epochs, or channels. In the present example, we have chosen to average the selected epochs.
- Display as separate graphs (rows). Choose what should be displayed in separate graphs (organized as rows). This can be the selected datasets, epochs, or channels.
- Display as superimposed waves. Choose what should be displayed as superimposed waves across graphs. This can be the selected datasets, epochs, or channels.
- X-axis and Y-axis. Manually set the X- and Y-axis range, or set the range to Auto for automatic adjustment. Because the X- and Y-axis range can also be modified using the zoom and navigation tools of the Graph window, the U button can be used to update X- and Y-axis settings using the currently displayed range.
- Explore interval. A time interval can be defined by editing the lower and upper limits, or by selecting a range in the Graph window. After defining the interval, the Table button can be used to generate a table of descriptive statistics of the data within the interval. The Scalp maps button can be used to generate 2D scalp maps of the maximum (e.g. a positive ERP peak) or minimum (e.g. a negative ERP peak) values in the interval (defined using the Maximum within interval or Minimum within interval dropdown list). The Head plots button can be used to generate a 3D head plot of the signals.
Several display options can be adjusted using the dropdown title menu:
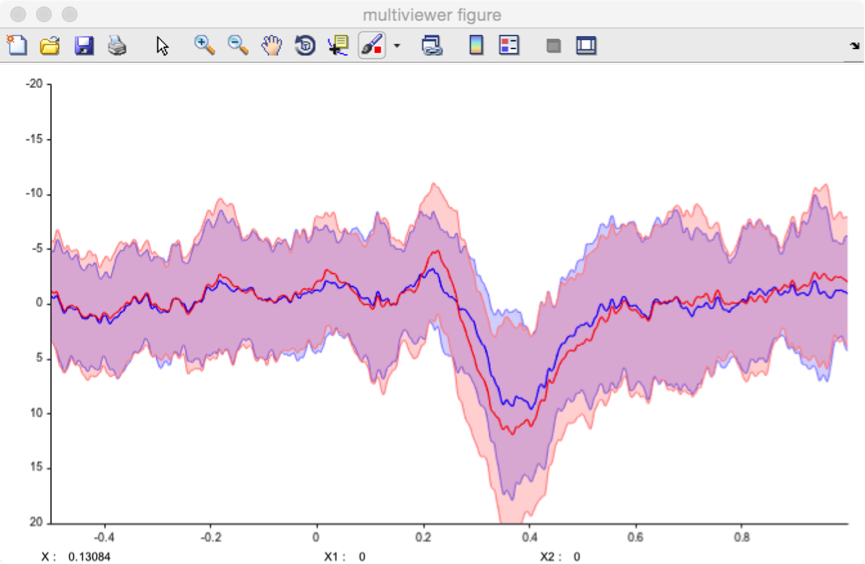
- Waveforms.
- Display mean. Only display average waveform.
- Display mean ± SD. Display average waveforms and standard deviation from the mean as a light area.
- Display median. Only display median waveforms.
- Display median ±iqr. Display median waveforms and interquartile ranges as a light area.
- Axes. The direction of the Y-axis can be set to normal (positive upwards), or reverse (negative upwards).
- Legend. A legend can be added to the graphs, displaying the name of the dataset, channel, or epoch.
- Set default. Set the current settings as default.
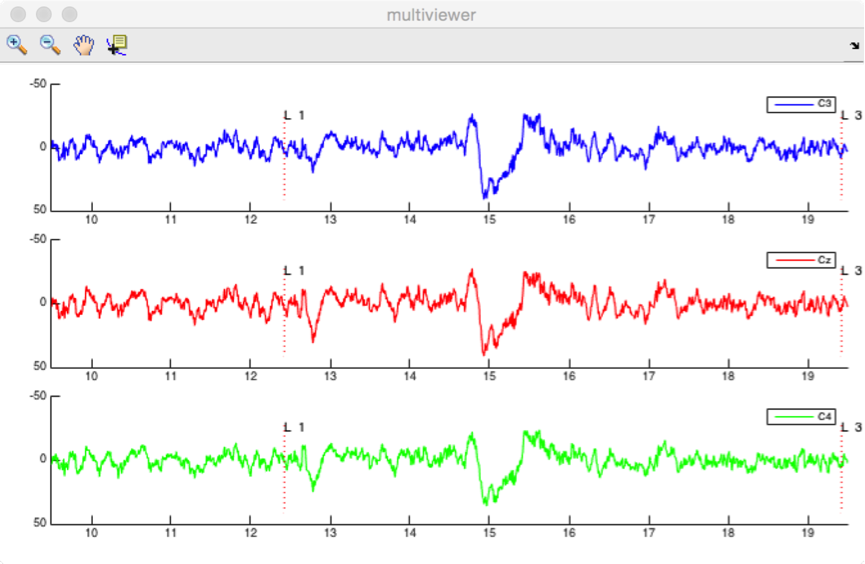
###Waveforms continuous data multi-viewer
This viewer is designed to view continuous (EEG) data.
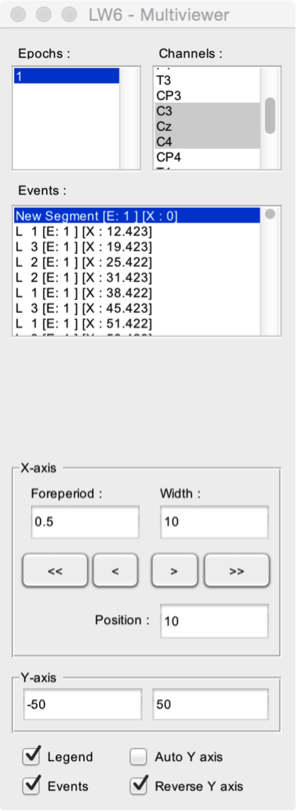
- Epochs. Select one or more epochs to display.
- Channels. Select one or more channels to display.
- Events. All events of the dataset are displayed sequentially in the Events listbox. The signal measured after the occurrence of an event can be viewed by selecting that event. The listbox also provides information as to the epoch associated with the event ([E]), and the latency of the event ([X]).
- X-axis. Define the time interval displayed in the graphs. The Foreperiod defines the time-interval to display before the onset of an event. The Width defines the width of the displayed signal window. The < and > buttons can be used to move backward and forward in the signal. The << and >> buttons can be used to move to the beginning or end of the recording. The actual position in the dataset is defined by the Position field.
- Y-axis. Manually set the Y-axis range, or set the range to Auto Y-axis for automatic adjustment.
- Legend. Display a legend on the graphs.
- Events. Display the events in the graphs.
- Reverse Y axis.
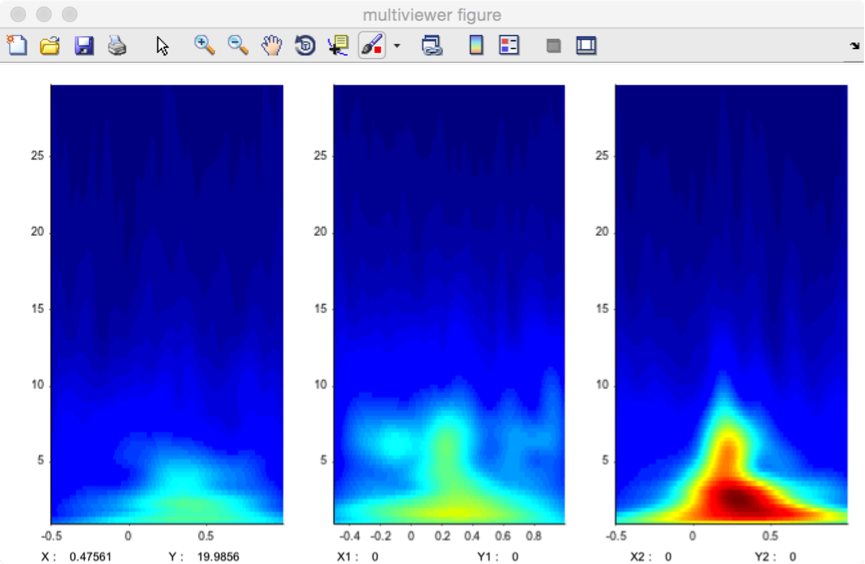
###Maps multi-viewer
This is the default viewer for time-frequency maps.
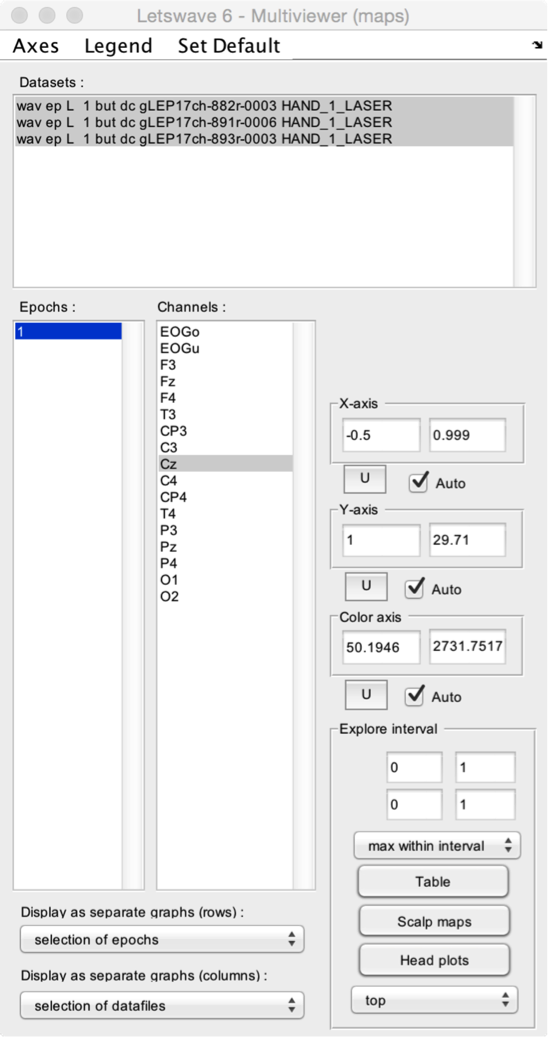
- Datasets. Select one or more datasets to display.
- Epochs. Select one or more epochs to display.
- Channels. Select one or more channels to display.
- Display as separate graphs (rows). Choose what should be displayed in separate graphs (organized as rows). This can be the selected datasets, epochs, or channels.
- Display as separate graphs (columns). Choose what should be displayed in separate graphs (organized as columns). This can be the selected datasets, epochs, or channels.
- X-axis and Y-axis. Manually set the X- and Y-axis range, or set the range to Auto for automatic adjustment. Because the X- and Y-axis range can also be modified using the zoom and navigation tools of the Graph window, the U button can be used to update X- and Y-axis settings using the currently displayed range.
- Explore interval. A X-axis and a Y-axis interval can be defined by editing the lower and upper limits, or by selecting a range in the Graph window. After defining the interval, the Table button can be used to generate a table of descriptive statistics of the data within the interval. The Scalp maps button can be used to generate 2D scalp maps of the maximum (e.g. event-related synchronization) or minimum (e.g. event-related desynchronization) values in the interval (defined using the Maximum within interval or Minimum within interval dropdown list). The Head plots button can be used to generate a 3D head plot of the signals.
Several display options can be adjusted using the dropdown title menu:
- Axes. A grid can be added onto the 2D maps.
- Legend. A legend can be added to the graphs, displaying the name of the dataset, channel, or epoch.
- Set default. Set the current settings as default.